Explore
Products
Zebra BI for Power BI
Zebra BI for Excel
Zebra BI for PowerPoint
Live Demo PBI
May 16, 2024
Live Demo Office
April 25, 2024
On-demand Product Tour
Resources
Zebra BI Academy
Resource Hub
Customer Stories
Templates
Webinars
Guides
Help
Help Center
Knowledge Base
Beginner's Guide
101 Crash Course
Chart Selector
Support
Why Zebra BI?
Our customers
Actionable reporting
Supercharge your Power BI
Calculate return on investment
Pricing
Search for:
Login
Try Zebra BI for free
Products
Zebra BI for Power BI
Zebra BI for Excel
Zebra BI for PowerPoint
Live Demo PBI
May 16, 2024
Live Demo Office
April 25, 2024
On-demand Product Tour
Pricing
Resources
Zebra BI Academy
Resource Hub
Customer Stories
Templates
Webinars
Guides
Help
Help Center
Knowledge Base
Beginner's Guide
101 Crash Course
Chart Selector
Support
Why Zebra BI
Our customers
Actionable reporting
Supercharge your Power BI
Calculate return on investment
Log In
Try For Free
Close
Upcoming webinar:
How to make your Power BI reports run up to 10x faster
September 8th
Register
Zebra BI Live Product Demo:
Start creating truly insightful Power BI reports and dashboards
February 22nd
Save the spot
Home
Resources
Warning
: Undefined property: WP_Error::$cat_ID in
/home/zebrabi/public_html/wp-content/plugins/oxygen/component-framework/components/classes/code-block.class.php(133) : eval()'d code
on line
19
Author:
Matija Kocevar
Author:
Matija Kocevar
Power BI
Guide
January 7, 2019
7 things that you can do in Zebra BI visuals that are hard to do in Power BI
Power BI is a powerful tool for analyzing and visualizing data, but it falls short in some areas. Find out how Zebra BI visuals can make your life easier.
Read more
Power BI
Guide
August 8, 2018
Mastering Variance Reports in Power BI
We explained the different types of variance reports and how to set them up in Microsoft Power BI to make reports clear and easy-to-understand.
Read more
Blog
June 29, 2018
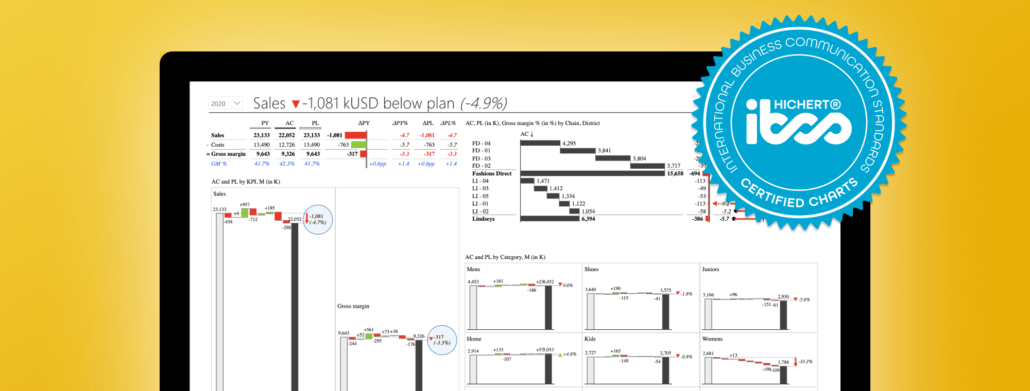
Zebra BI becomes the first IBCS®-certified reporting solution for Power BI
Zebra BI Visuals for Power BI has achieved a major milestone by receiving the IBCS® certificate to ensure clarity and consistency.
Read more
Power BI
Guide
June 1, 2018
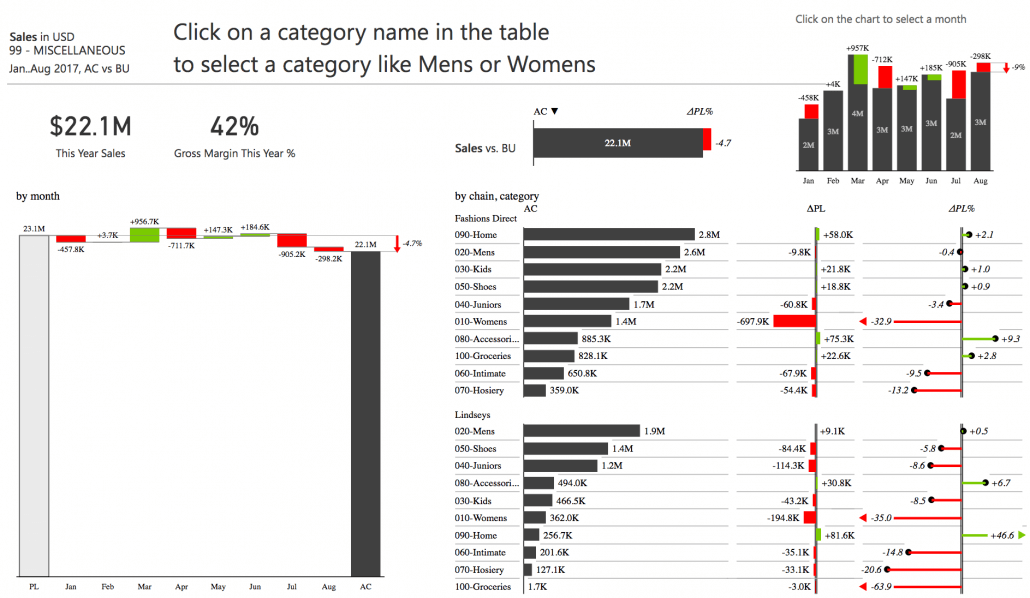
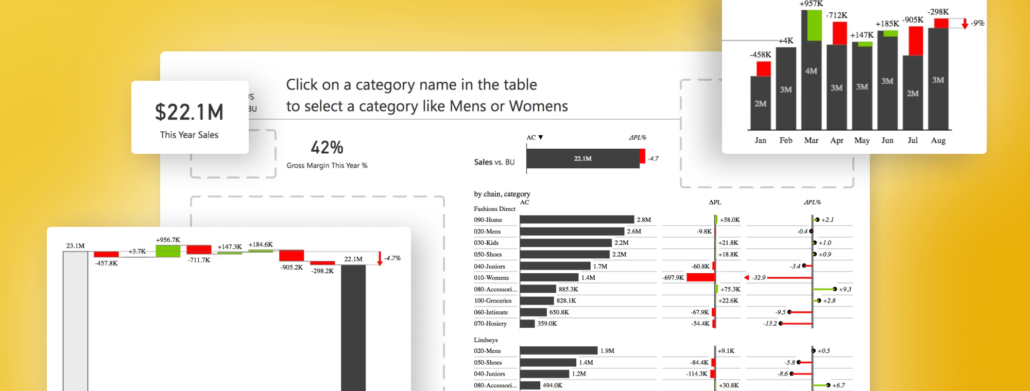
Build Spectacular Power BI Dashboards using Zebra BI custom visuals
Get to knowall of the features that Zebra BI offers and how they contribute to better reporting experience in Power BI.
Read more
Pagination
1
2
»
Product
Zebra BI for Power BI
Zebra BI for Excel
Zebra BI for PowerPoint
Latest Releases
Changelog
Zebra BI for Power BI Pricing
Zebra BI for Office Pricing
Resources
Webinars
Templates
Guides
Zebra BI Academy
Blog
Community Events
Legal documentation
Help
On-demand product tour
Live product demo
Knowledge base
Beginner’s Guide
Zebra BI 101 Crash Course
Chart Selector
Company
About
Careers
Customers
Become an Affiliate
Find a Partner
Terms of Website Use
Contact Sales
Technical Support
© 2021 – 2024 Copyright Zebra BI d.d. All rights reserved. Various trademarks held by their respective owners.
Privacy Policy
Legal documentation
Try it in your Excel. For free.
angle-up
angle-down
youtube-play
question-circle-o
dropdown-down
TimelineArrow
arrow
download
facebook
ln
logo-black
menu
no
search
twitter
 September 8th
 February 22nd