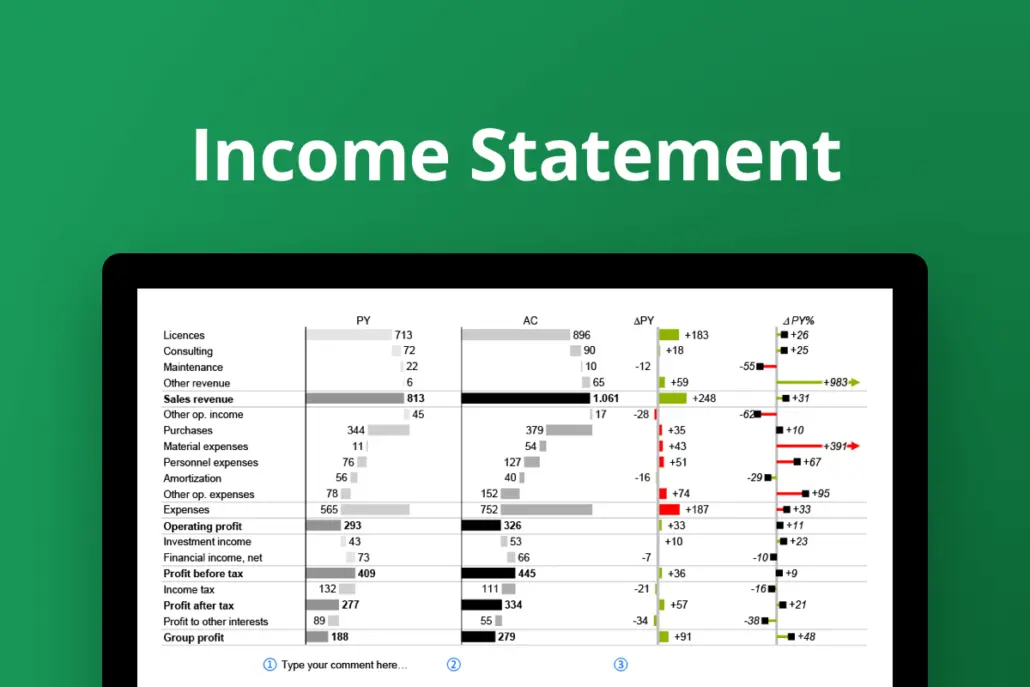
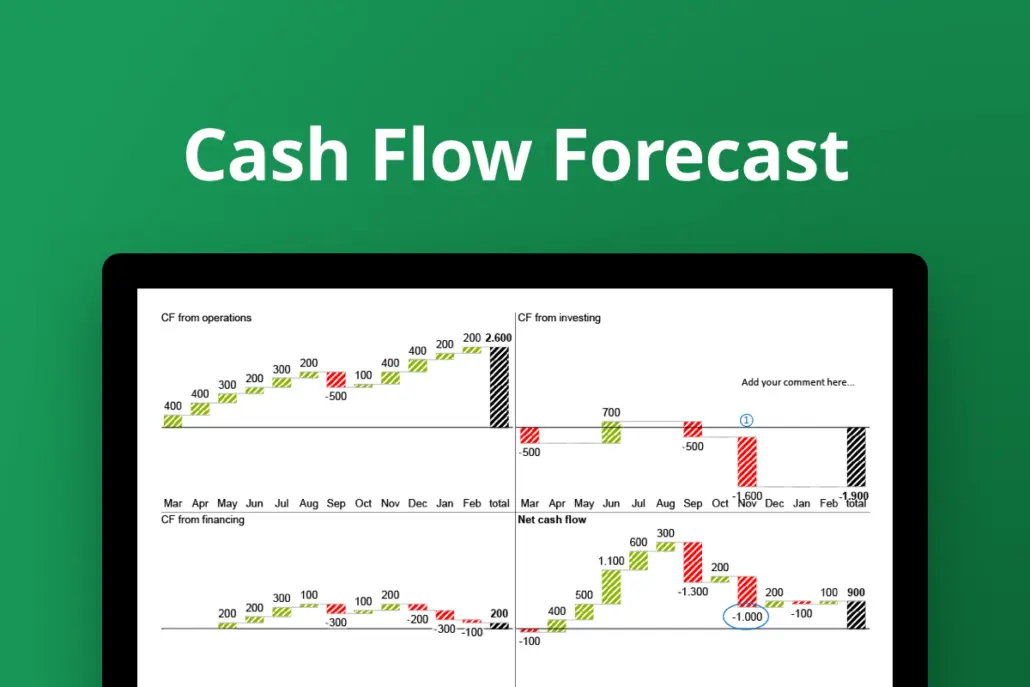
This Excel template allows you to visualize your Profit & Loss data for current and previous year using vertical waterfall charts, absolute and relative variance charts.
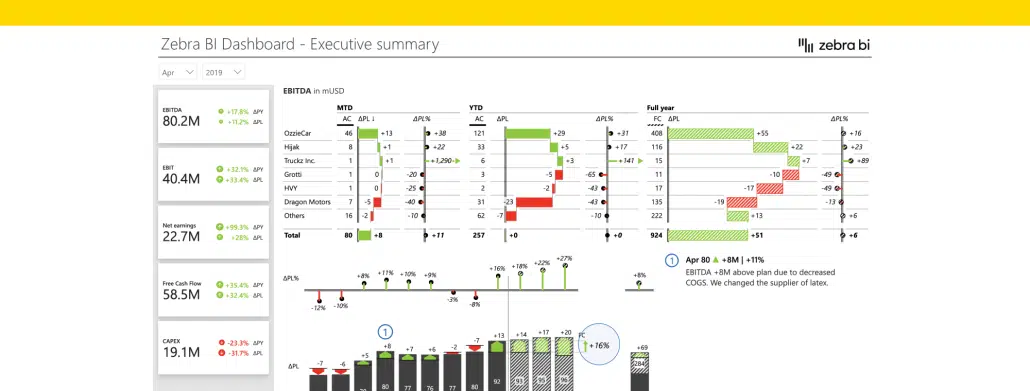
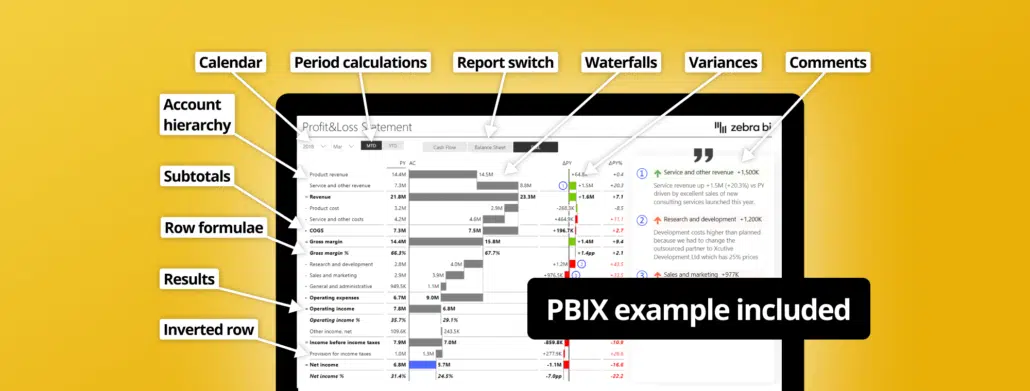
This Power BI template is designed to help you make an actionable overview of financials for the management. Spoiler alert: it includes lots of waterfall charts.
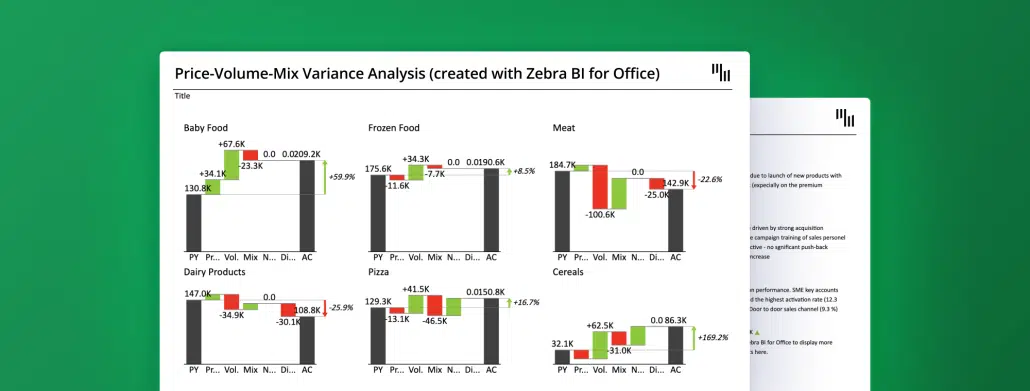
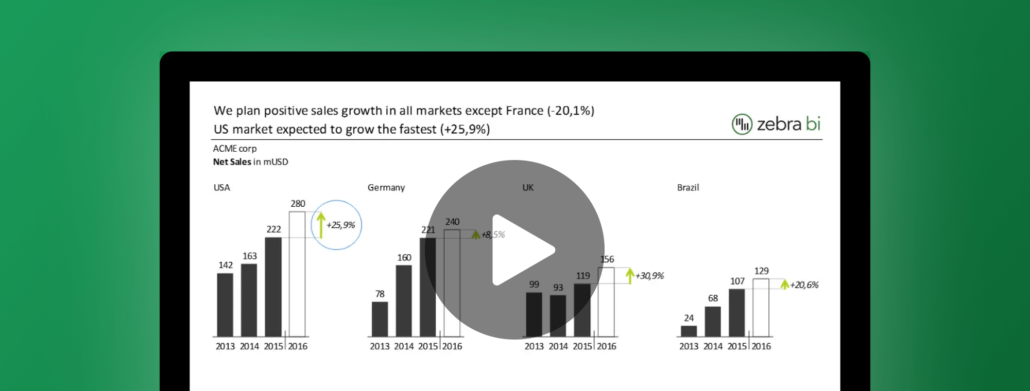
Discover the Excel report templates that will transform the way you design your most important financial reports inspired by Coca-Cola, Bayer and others.
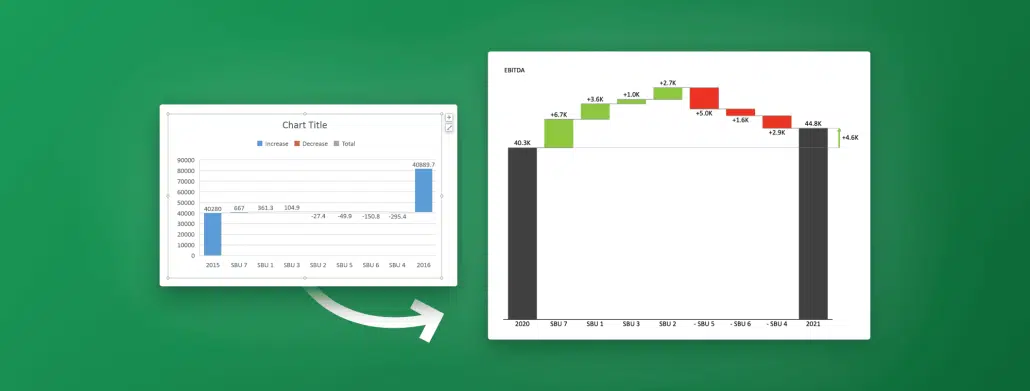
Learn how to create a visually appealing waterfall chart in Excel with our step-by-step guide. From beginners to experienced users, our guide provides all the necessary tips and tricks to impress your audience.
 September 8th
 February 22nd
 23 May 2024