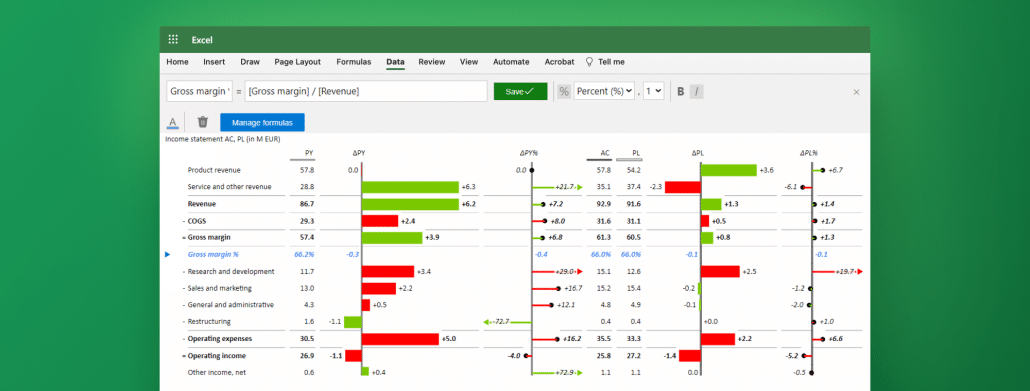
Traditional reporting is broken. The good news? You can future-proof your financial reporting (easily). Here's a quick webinar overview on this specific topic, click to learn more about modernizing financial reports, from our Senior BI Consultant, Mark.
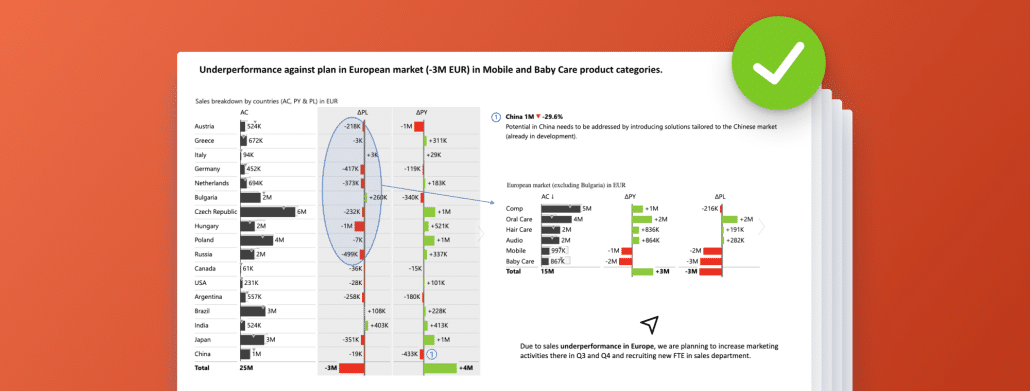
How can CFOs navigate the complex landscape of financial reporting and driving decision-making in 2025? Here's what you need to know about the Office of the CFO and how to turn a seemingly increasing number of responsibilities into wins for your organization.
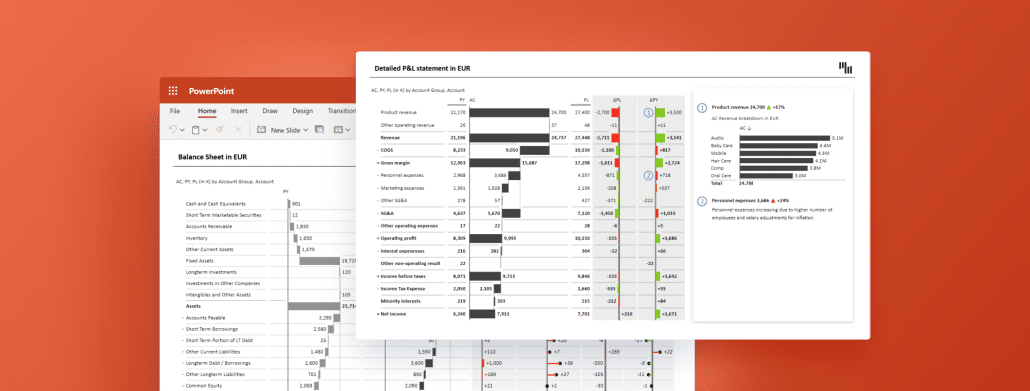
Explore expert tips for creating professional PowerPoint for FP&A analysts. Learn to create consultant-level, visually engaging presentations efficiently.
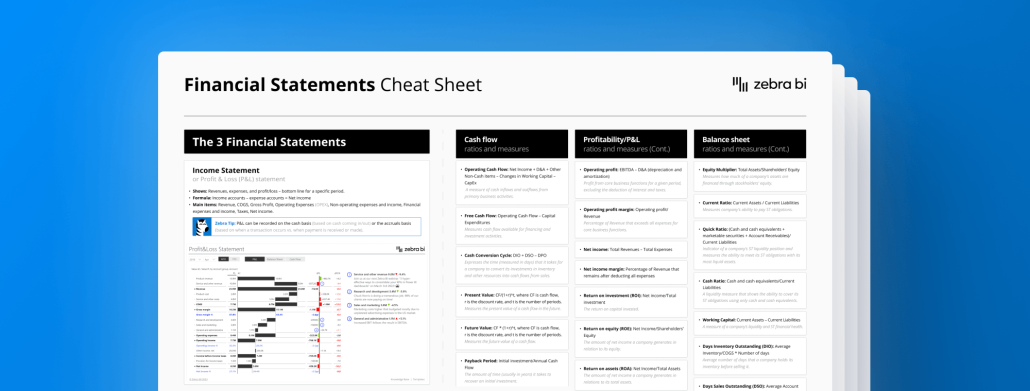
Master the world of financial analysis with our handy financial statements cheat sheet. Your passport to easy understanding of balance sheets, income statements, and more!
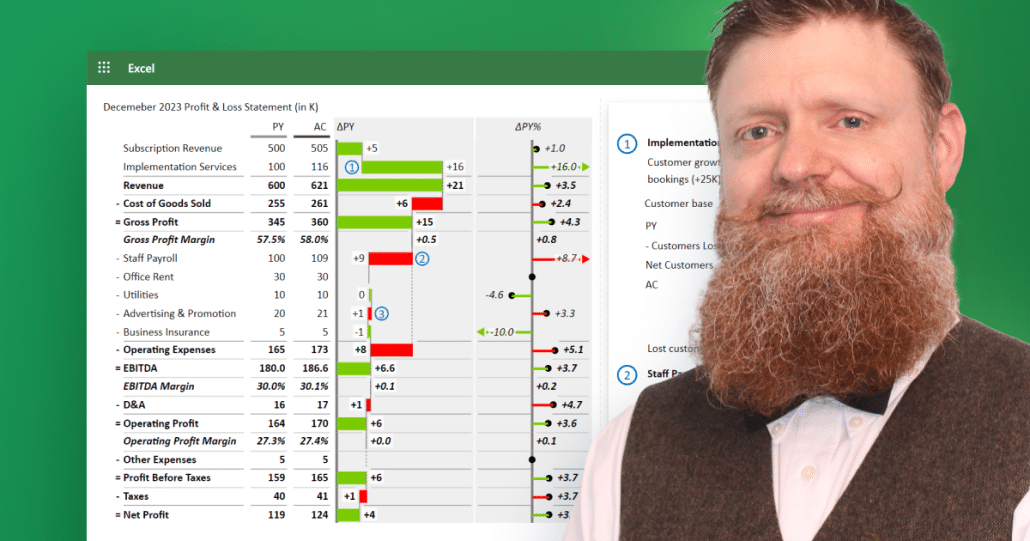
Discover what EBITDA is, learn how to calculate it, and explore ways to effectively present it for strategic financial analysis in our comprehensive guide.
 September 8th
 February 22nd
 05 Mar 2026