How to Calculate and Interpret Financial Ratios in Excel
Financial ratios are the most powerful tool for investors, business owners, and managers alike to measure an organization's performance. Knowing how to calculate and analyze them is a crucial skill that every professional should possess, especially those who want to make informed decisions that directly impact their organization's future. In this article, we'll deeply dive into financial ratios and demonstrate how to calculate and interpret them in Excel.
Understanding the Importance of Financial Ratios in Business
Financial ratios provide valuable insights into a company's financial health, allowing stakeholders to make informed decisions. These ratios are like a financial report card, showing the company's performance across different aspects like profitability, efficiency, liquidity, and solvency. Investors use financial ratios to gauge a company's potential, while business owners and managers use them to identify areas of improvement and make data-driven decisions. Understanding how to interpret financial ratios is essential to make these informed judgments.
One of the most commonly used financial ratios is the debt-to-equity ratio, which measures a company's leverage by comparing its total liabilities to its shareholder equity. A high debt-to-equity ratio indicates that a company relies heavily on debt to finance its operations, which can be risky in the long run. Another important ratio is the return on investment (ROI), which measures the profitability of an investment relative to its cost. A high ROI indicates that an investment generates significant returns, while a low ROI may suggest that the investment is not worth pursuing.
It's important to note that financial ratios should not be used in isolation but rather in conjunction with other financial metrics and qualitative factors. For example, a company may have a high debt-to-equity ratio, but it may still be a good investment if it has a strong cash flow and a solid business model. Similarly, a company with a low ROI may be investing in long-term growth opportunities that will pay off in the future. Therefore, it's crucial to consider the context and the bigger picture when analyzing financial ratios.
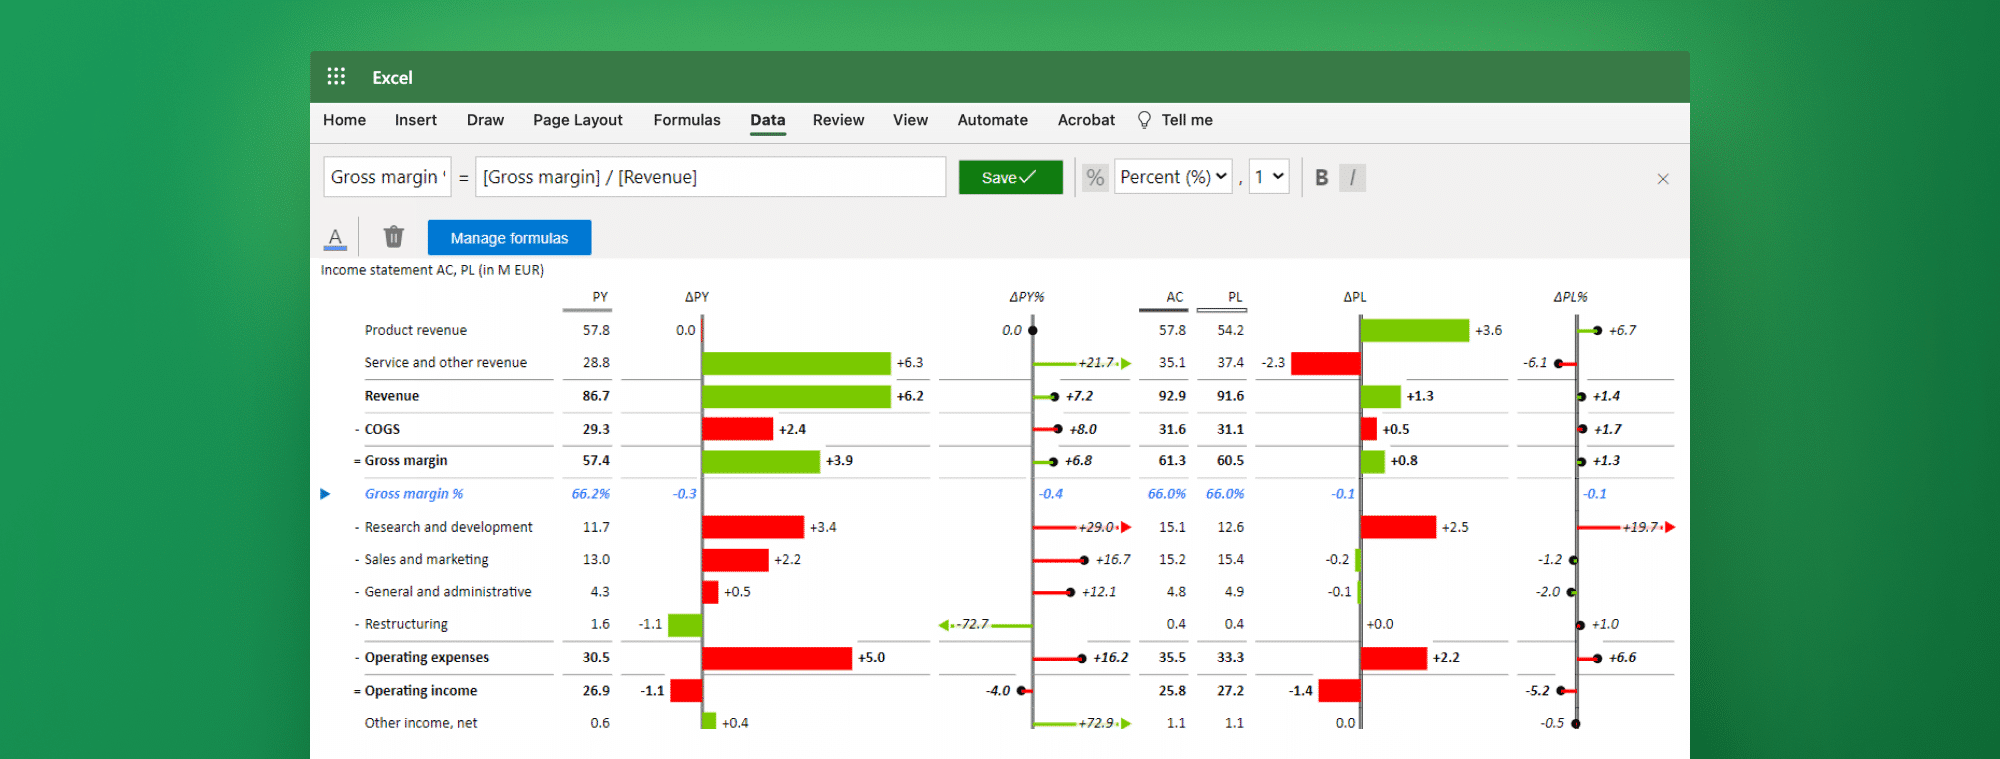
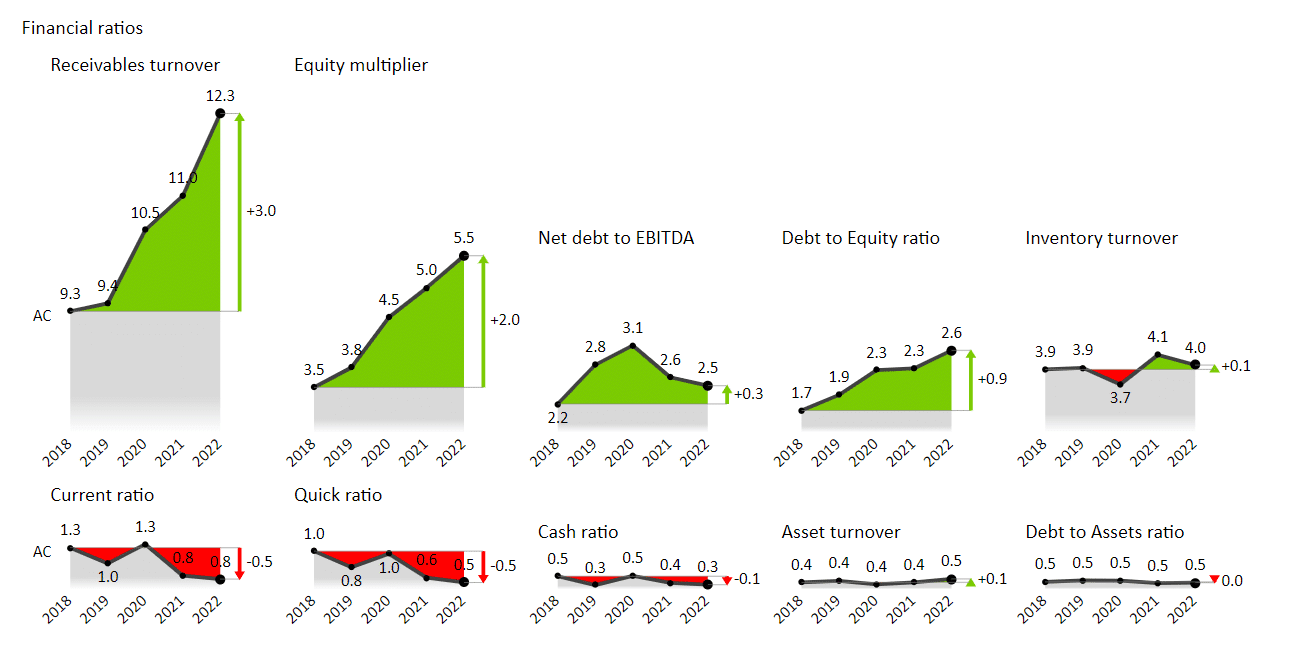
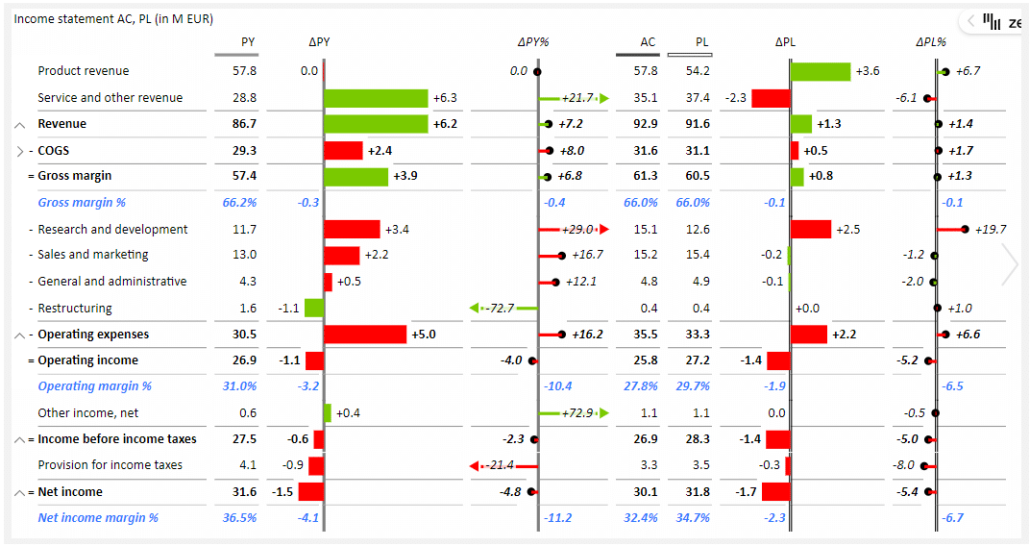
To get the bigger picture, it is good to look at the ratios in combination with financial statements and trends to understand the background of calculation and how the ratio has been developing through time → download the Financial Cheat Sheet; it will help you understand financial accounts and ratios.
In that way, you could also have an overview of formula inputs and what is driving the ratio. Ratio trends:
Different Types of Financial Ratios and Their Significance
There are several types of financial ratios, each providing a different perspective on how a company is performing. Four of the most significant financial ratios are profitability, liquidity, efficiency, and solvency ratios. Profitability ratios like gross profit margin, operating profit margin, and net profit margin measure how much profit a company generates relative to its revenue.
Liquidity ratios like current and quick ratios gauge a company's ability to meet its short-term obligations.
Efficiency ratios like asset turnover ratio measure how well a company uses its assets to generate revenue. Finally, solvency ratios like debt to equity ratio and interest coverage ratio assess if a company can meet its long-term debt obligations.
It is important to note that financial ratios should not be viewed in isolation but rather in conjunction with other financial metrics and qualitative factors. For example, a company may have a high profitability ratio, but if it is heavily reliant on one product or customer, it may be at risk if that product or customer declines. Additionally, financial ratios can vary significantly between industries, so it is important to compare a company's ratios to its peers within the same industry. Financial ratios can provide valuable insights into a company's financial health and performance by considering these factors.
Using Excel to Calculate Financial Ratios - A Step-by-Step Guide
Excel is one of the most commonly used financial analysis tools, and it's relatively easy to use, even for those who aren't experts in finance. Here's a step-by-step guide to help you calculate financial ratios in Excel:
- First, input the financial data into the Excel sheet, such as financial statements like a balance sheet, income statement, or cash flow statement.
- Identify the different ratios you'd like to calculate based on the financial data you've inputted.
- Create a separate table where you can input the formulas to calculate ratios. You should have one table for each category of ratios, e.g., profit margins, liquidity ratios, etc.
- Input the formula into each cell of the ratio table, referencing the data you inputted in the financial statement table.
- Once you've inputted the formulas, Excel will calculate the ratios for you, and you can interpret the ratios to make informed decisions about the organization.
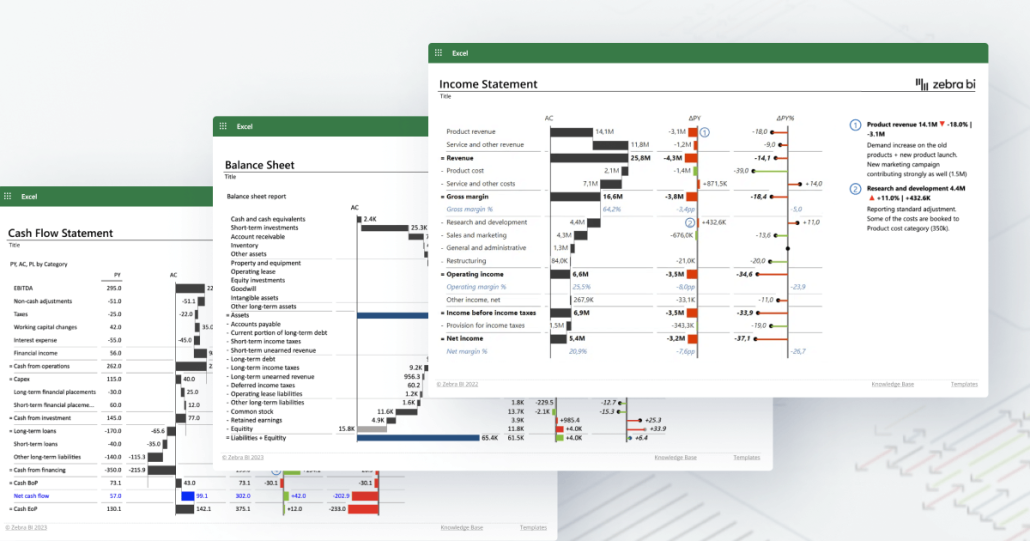
Regarding step 3, it's good to know that, alternatively, ratios can be calculated in the same table, for example, to support income statement analysis. Learn how to do it: Adding Custom Formulas in Zebra BI Table.
It's important to note that financial ratios should not be analyzed in isolation. Instead, they should be compared to industry benchmarks or historical trends to provide context and meaning. Additionally, it's crucial to understand the limitations of financial ratios and use them in conjunction with other financial analysis tools to understand an organization's financial health comprehensively.
Download the Financial Statements Cheat Sheet: Your Secret Weapon in Financial Analysis and understand financial accounts and ratios better.
Common Accounting Terms Used in Financial Ratio Calculation
Before diving into calculating financial ratios, it's essential to understand some common accounting terms that you'll come across in financial statements. These include revenue, cost of goods sold, gross profit, operating expenses, net profit, assets, liabilities, and equity, to name a few. Understanding what these terms mean is the foundation for calculating financial ratios accurately.
One important term to understand is depreciation. Depreciation is the decrease in the value of an asset over time due to wear and tear, obsolescence, or other factors. It is important to consider depreciation when calculating financial ratios, as it can impact the value of assets and the overall financial health of a company. Another term to be aware of is accruals, which are expenses that have been incurred but not yet paid. Accruals can affect financial ratios, such as the current ratio, which measures a company's ability to pay its short-term debts.
The Power of Ratio Analysis for Business Planning and Decision-Making
Ratio analysis is a powerful tool that allows businesses to make more informed decisions, whether it is to increase revenue, reduce costs, or analyze investments. Ratio analysis provides valuable insights into the organization's performance and can be used to develop business strategies and goals. Businesses can also use ratio analysis to compare their performance to similar companies in the industry and benchmark themselves against the competition.
One of the key benefits of ratio analysis is that it can help businesses identify areas where they need to improve. For example, if a company's current ratio is lower than the industry average, it may indicate that it is struggling to meet its short-term obligations. By identifying this issue, the company can take steps to improve its liquidity and financial health.
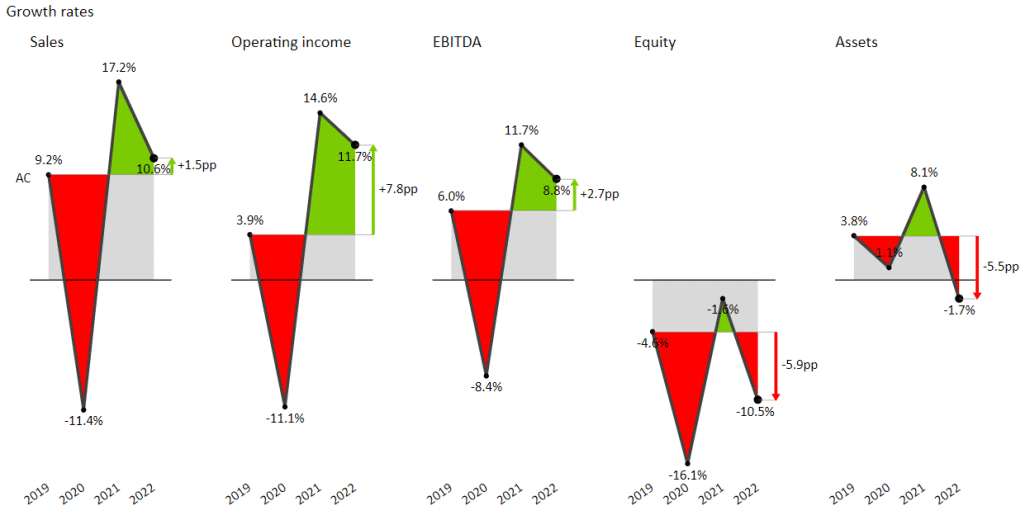
Another advantage of ratio analysis is that it can help businesses identify trends over time. By comparing ratios from different periods, businesses can see how their performance has changed and identify areas where they have made progress or need to improve. This information can be used to make more informed decisions about future investments and business strategies.
What Do Your Financial Ratios Indicate About Your Business Performance?
Your financial ratios reveal critical information about your company's financial health. For example, if you have a low profit margin, it may indicate that you're not generating enough revenue or that your expenses are too high. If your liquidity ratio is low, it may suggest that you don't have enough cash to meet your short-term obligations. Analyzing your financial ratios allows you to identify areas of improvement and make strategic decisions to improve your performance.
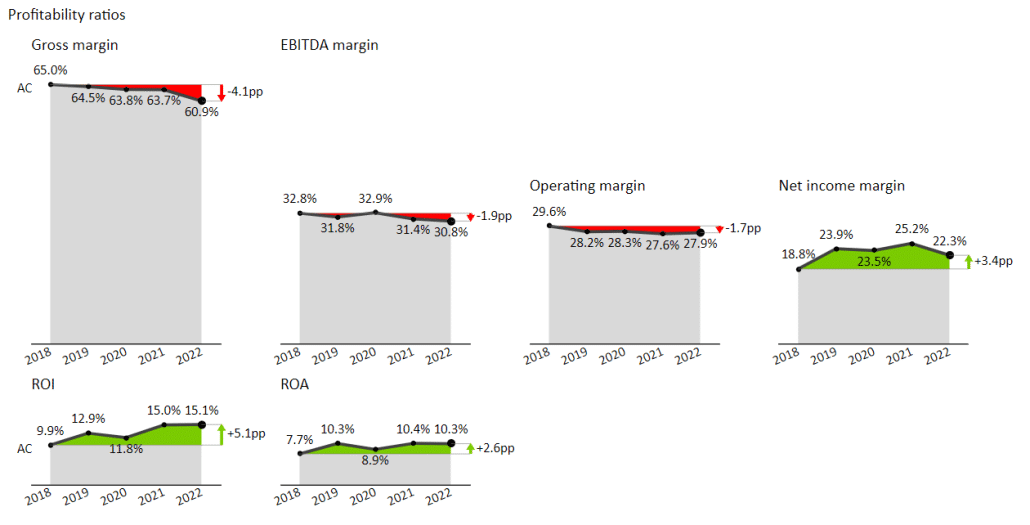
Interpreting Profitability Ratios to Measure a Company's Profit Potential
Profitability ratios measure how much profit a company is generating relative to its sales. Gross profit margin, operating profit margin, and net profit margin are some of the most commonly used profitability ratios. Gross profit margin measures how much of each dollar of revenue is left after deducting the cost of goods sold, while operating profit margin measures how much profit remains after subtracting operating expenses. Net profit margin calculates how much profit a company generates after all expenses are deducted. A higher profit margin suggests that a company generates more profit per dollar of revenue, indicating better profitability.
Analyzing Liquidity Ratios to Determine a Company's Ability to Meet Short-term Obligations
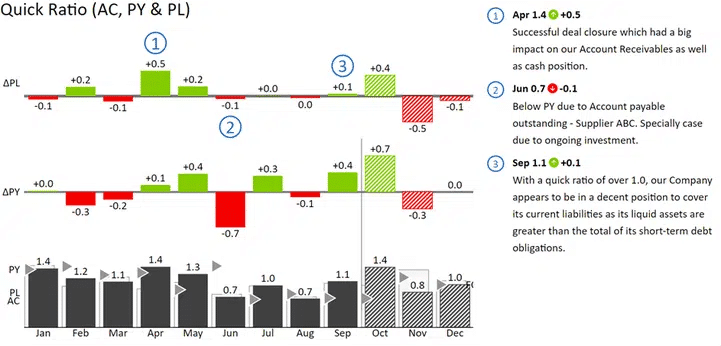
Liquidity ratios help determine a company's ability to meet its short-term obligations. The current and quick ratio are the two most commonly used liquidity ratios. The current ratio measures how many current assets a company possesses relative to its current liabilities, while the quick ratio measures how many quick assets a company has (current assets minus inventory) relative to its current liabilities. These ratios are essential for businesses that require regular cash flow to pay their expenses, as it shows how quickly the company can turn its assets into cash to meet its obligations.
Learn more: Cracking the code: What are liquidity ratios & how to present them effectively?
Understanding Efficiency Ratios and Their Role in Measuring Operational Performance
Efficiency ratios measure a company's ability to use its assets to generate revenue. Common efficiency ratios include asset turnover ratio, inventory turnover ratio, and accounts receivable turnover ratio. The asset turnover ratio measures how efficiently a company uses its assets to generate revenue, while the inventory turnover ratio and receivables turnover ratio measure the rate of utilization of inventory and the average collection period of outstanding debts, respectively. These ratios are helpful for companies to identify bottlenecks in their operations and improve their efficiency for better performance.
Examining Solvency Ratios to Assess a Company's Long-Term Debt Repayment Capacity
Solvency ratios help assess a company's long-term debt repayment capacity. These ratios measure how much debt a company has relative to its equity and earnings. Common solvency ratios include debt-to-equity ratio, debt-to-assets ratio, and interest coverage ratio. These ratios are essential for companies that have significant long-term debt obligations, and they show if a company has enough equity or earnings to cover its debt repayments. It's essential for companies to maintain a healthy debt-to-equity ratio, as high levels of debt can increase the risk of insolvency.
Tips for Accurate Financial Ratio Calculations and Interpretation in Excel
To ensure the accuracy of financial ratio calculations in Excel, it's essential to input data correctly, use the correct formulas, and understand the ratios you're calculating. Always double-check your inputs and ensure you're using the correct formula for the ratio you're calculating. It's also important to interpret the ratios in the context of the industry and the organization's goals and objectives to make informed decisions.
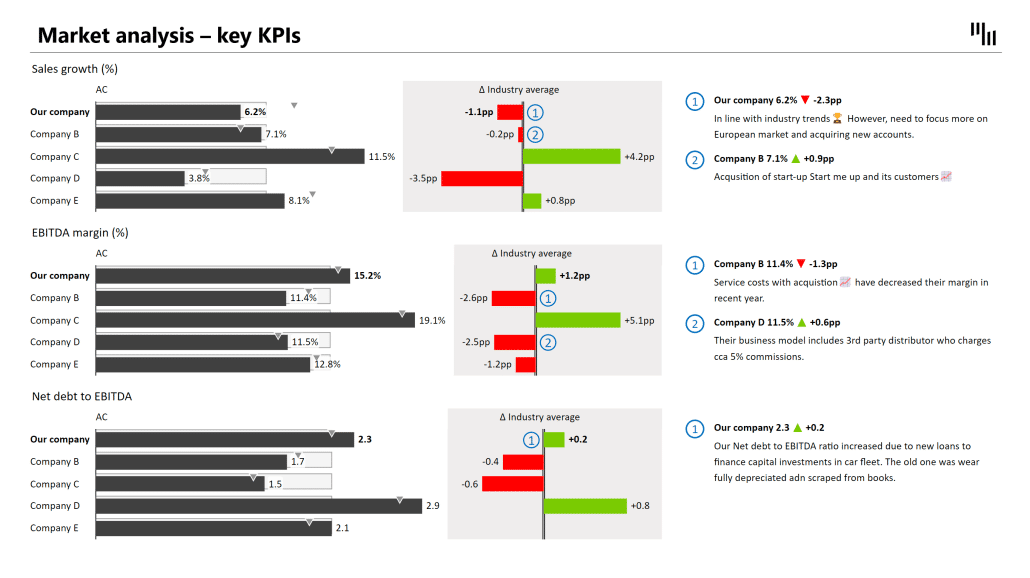
How to Use Industry Benchmarking with Financial Ratios for Competitive Advantage
Industry benchmarking compares your organization's performance against other companies in the same industry. It's a valuable tool that enables businesses to identify areas of weakness, areas of opportunity, and industry best practices. When performing industry benchmarking using financial ratios, make sure you identify comparable companies in the same industry and that the companies have a similar business model, size, and scope. Benchmarking is a great way to gain a competitive advantage and improve performance.
Conclusion: Leveraging Financial Ratios to Drive Growth, Increase Profitability, and Mitigate Risk
Financial ratios are an essential tool for investors, business owners, and managers to make data-driven decisions. Understanding how to calculate and interpret financial ratios in Excel is crucial to gaining insights into the organization's performance and making informed decisions. By leveraging financial ratios, businesses can drive growth, increase profitability, and mitigate risks, making ratio analysis an indispensable asset for organizations of all sizes and industries.
After your analysis, don’t forget to present your ratios with Zebra BI visually compliant with IBCS standards to ensure maximum efficiency while communicating business performance.