 September 8th
 February 22nd
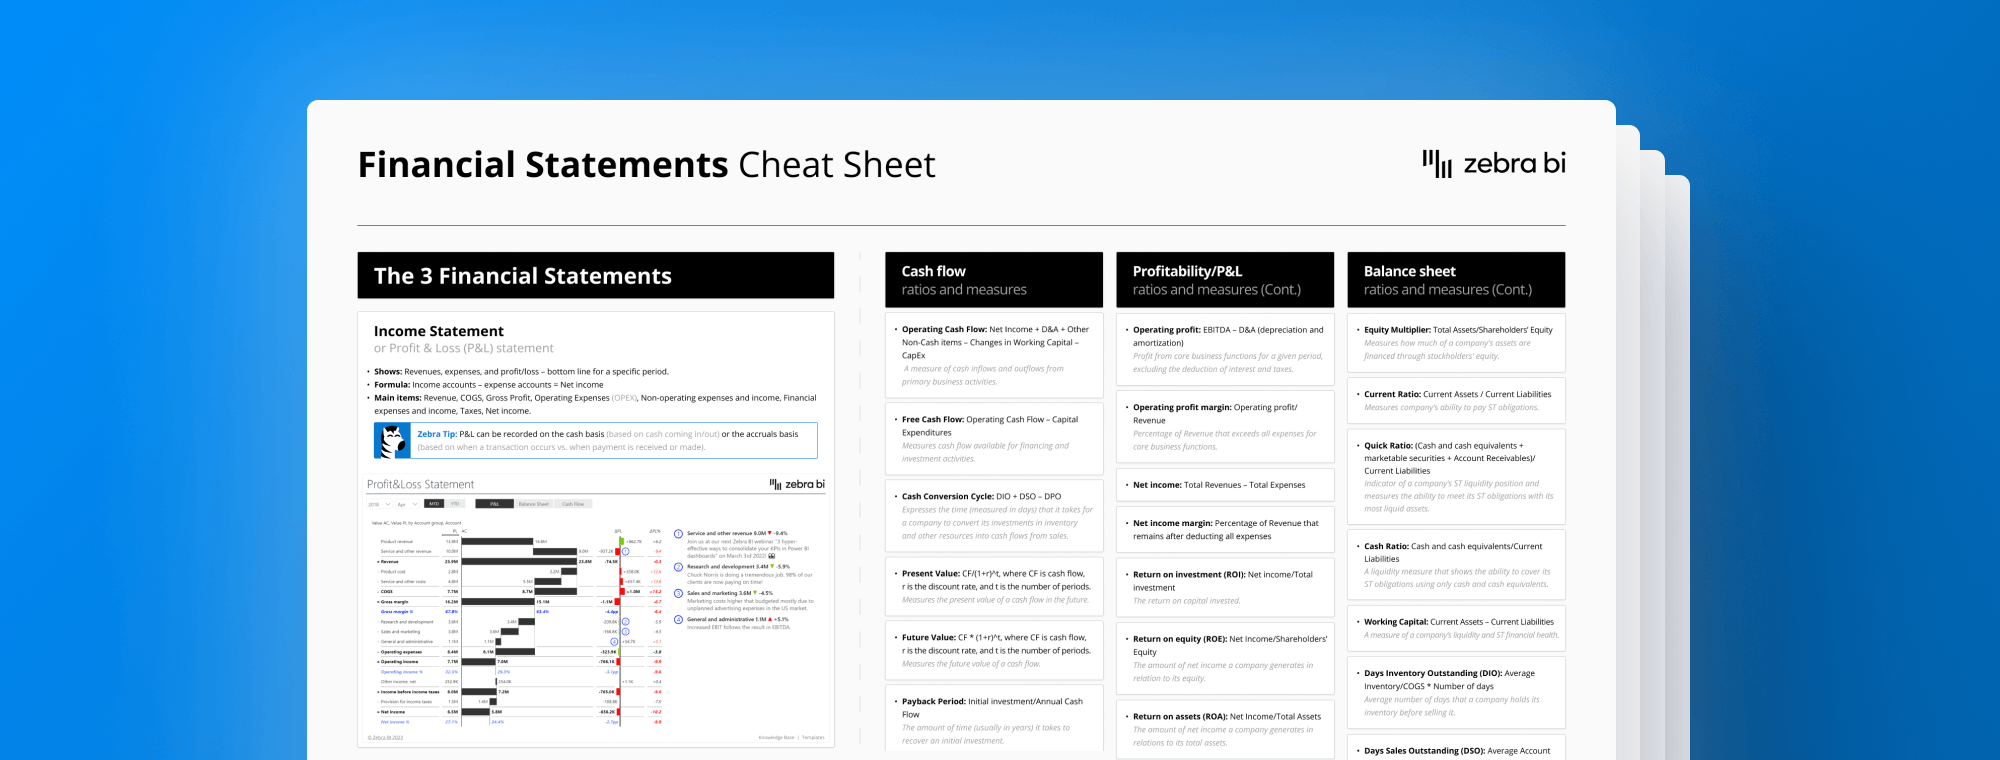
Financial Statements Cheat Sheet: Your Secret Weapon in Financial Analysis
PRO Trial
Welcome to the wonderful, yet sometimes perplexing, world of financial statements. If you're an FP&A professional, you know these documents are your bread and butter, the language you use to weave stories of profit margins, solvency ratios, and cash flow realities. But wouldn't it be great if you had a secret decoder ring to simplify this complex lexicon? Enter our financial statements cheat sheet - your trusty new sidekick in the financial analysis battleground.
Understanding financial statements is not just crucial; it's non-negotiable in the FP&A realm. These documents tell you the financial health of a company - the profits, the losses, the assets, the liabilities, the inflow, and outflow of cash. It's like a corporate health check-up report, but instead of blood pressure and cholesterol levels, you've got gross profit margins and debt-to-equity ratios.
Just when you thought these statements couldn't get any more exciting, we've decided to raise the bar a notch higher. Our cheat sheet takes the guesswork out of financial analysis and distills it into an easy-to-understand format. Dive in to explore how it can boost your financial analysis skills, turning the numbers into captivating stories that can leave an impression in the boardroom.
Understanding Financial Statements: Importance and Overview
Financial statements, to put it simply, are a company's report card. And as an FP&A professional, you're the principal, evaluating the performance and predicting the future prospects of the business. In this role, having a firm grasp on financial statements is imperative to effectively steer strategic planning, financial forecasting, and budgeting.
But what do these report cards consist of? Let's strip it back to the basics: The Income Statement, Balance Sheet, and Cash Flow Statement.
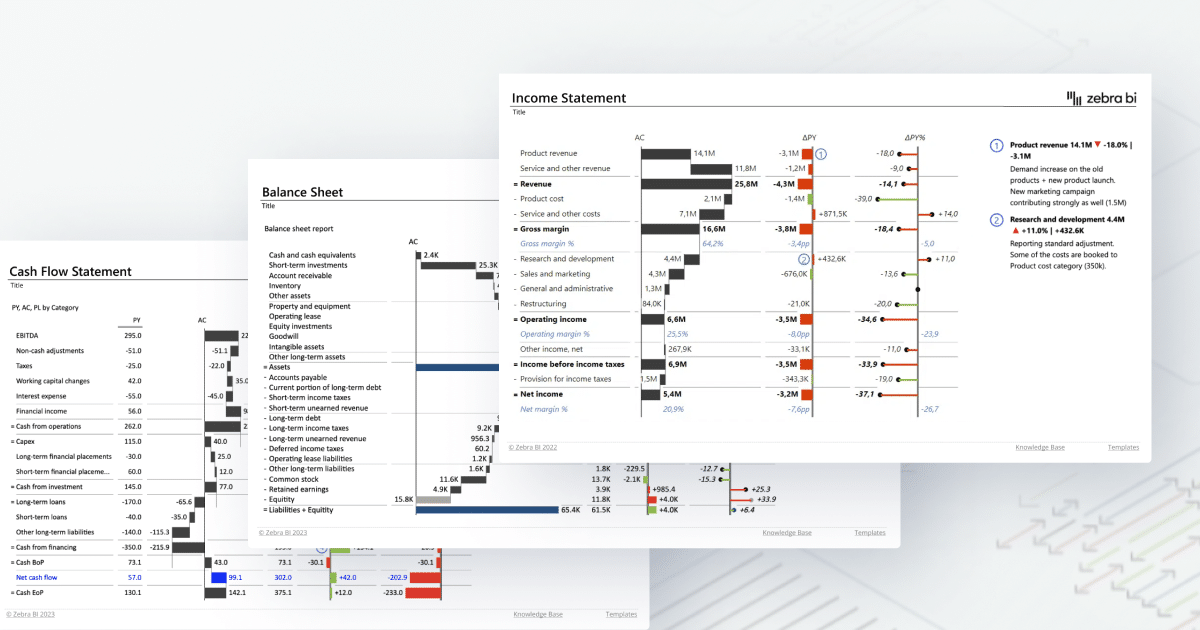
- The Income Statement, also known as the Profit & Loss Statement, is like a stopwatch. It measures the company's financial performance over a specific period, tallying revenues, costs, expenses, and ultimately calculating profit or loss. Like a race, it's all about speed - or in this case, earnings.
- The Balance Sheet, on the other hand, is a snapshot. It gives you a picture of what a company owns (assets) and owes (liabilities) at a particular point in time, as well as the equity that remains for shareholders. Consider it the Instagram of financial statements, capturing the company's financial state in one frame.
- Then comes the Cash Flow Statement. Think of it as the company's bank statement. It reveals how the company is generating and using cash from three areas: operational activities, investment activities, and financing activities. It's the proof of where the cash is flowing, highlighting the cash-generating ability of the company.
Together, these statements form the backbone of financial analysis, enabling you to assess a company's profitability, liquidity, and financial stability. Understanding them is akin to reading the vital signs of a company - it allows you to diagnose current health and forecast future performance. This is where our financial statements cheat sheet becomes a lifesaver.
Introducing the Financial Statements Cheat Sheet
Now let's get down to business. This financial statements cheat sheet is more than just a document - consider it your trusty guide, a mentor, a compass in the sometimes foggy terrain of financial analysis. The cheat sheet demystifies the complexity of financial statements, turning intricate jargon into straightforward language that's as easy to understand as your morning coffee order.
But what exactly does it include, you ask?
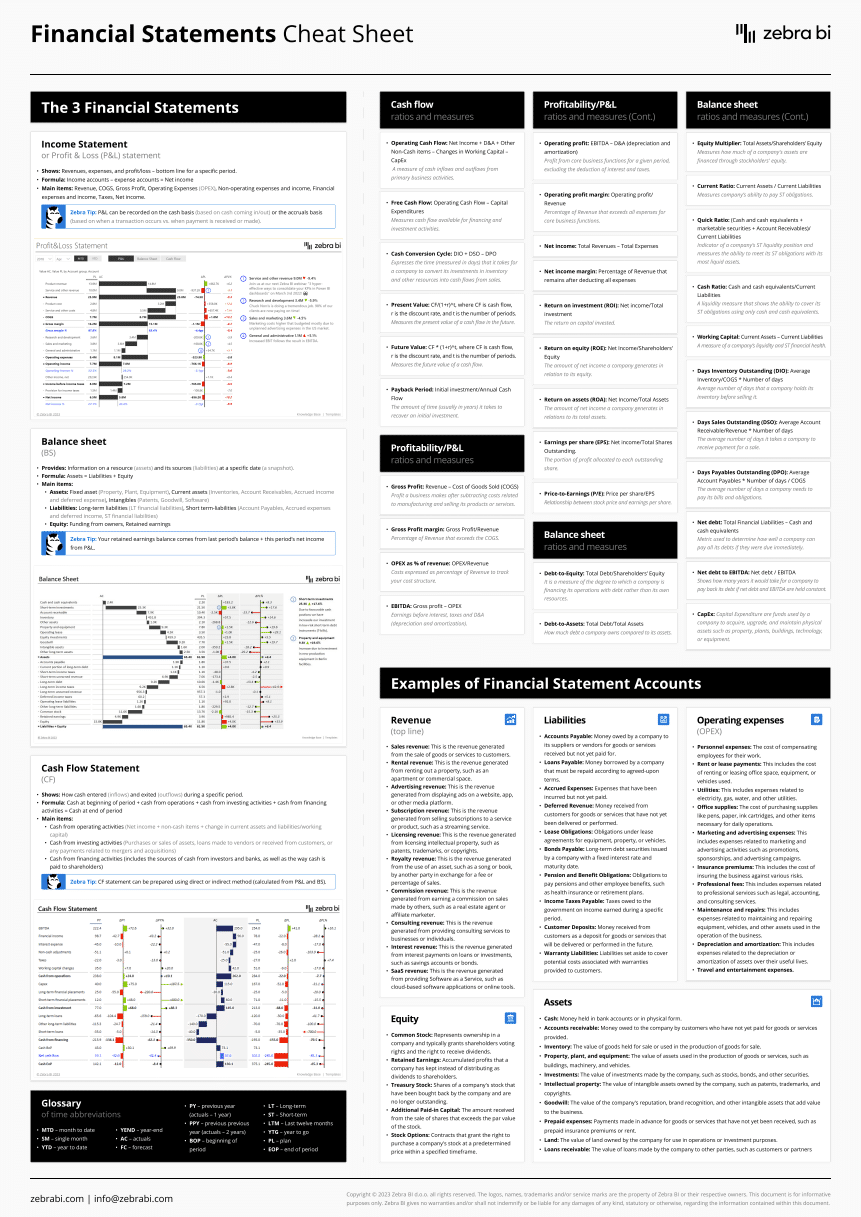
Our cheat sheet provides an overview of the basic components and principles of the three key financial statements: the Income Statement, the Balance Sheet, and the Cash Flow Statement. It's like a 101 guide to understanding the what, why, and how of these statements, making them as easy to comprehend as a leisurely Sunday newspaper read.
What about financial ratios, you wonder? We've got that covered too. The cheat sheet transforms intimidating ratios into friendly neighbors, ready to offer insights about a company's financial health.
To make things even more understandable, we've sprinkled in some illustrative examples, along with IBCS-compliant visualizations. This is where theory meets practice, all packaged in a way that's as exciting as your favorite detective novel.
Finally, we've included a handy glossary of abbreviations. No more scratching your head over mysterious acronyms. Voila, your personal finance lingo translator to help you make sense of the complex business language and enable you to navigate the financial landscape with ease and confidence.
Your Financial Upgrade is One Click Away!
Grab your financial statements cheat sheet now, and let's dive into the world of balance sheets, income statements, and cash flow like it's our favorite comic book. Hit that download button below, and let's get this financial party started!
Wrapping Up: Your Launchpad to Financial Wizardry
In the grand scheme of FP&A, financial statements can seem like towering giants. But with the financial statements cheat sheet in your back pocket, you're equipped with the magic beans to scale those giants. It's not just a guide; it's your companion on the exhilarating journey of financial analysis.
The cheat sheet breaks down the essential components of financial statements, demystifies crucial financial ratios, offers practical examples, and serves as your translator for all those pesky abbreviations. It's like having a financial whizz by your side, guiding you through the maze of numbers and ratios.
So, why wait? Embrace the financial statements cheat sheet, your passport to a simpler and more enjoyable world of financial analysis. As you embark on this adventure, remember - every great story needs a hero, and every FP&A professional needs their cheat sheet.
Boost your financial analysis with next-level visualization
You've got your financial statements cheat sheet, you're mastering the numbers - now let's bring those numbers to life! Zebra BI transforms your financial data into dynamic, easy-to-understand visuals. One click, and your financial analysis leaps off the screen. Ready to see your data in full color? Try Zebra BI today!
Zebra la mejor plataforma de análisis felicitaciones