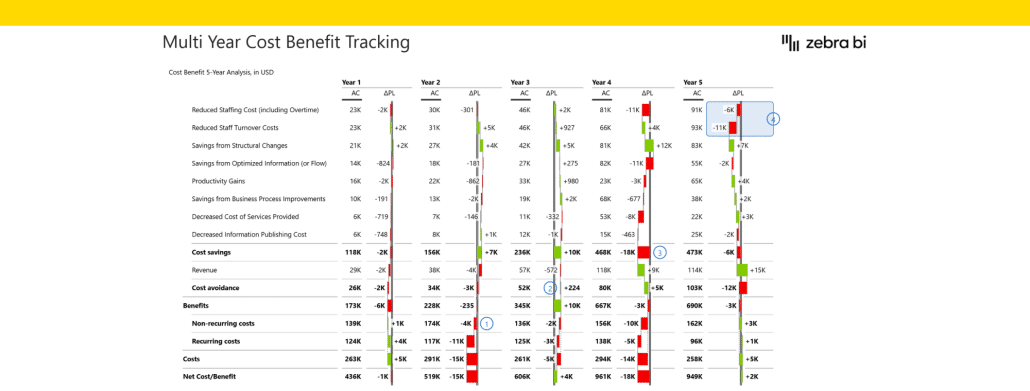
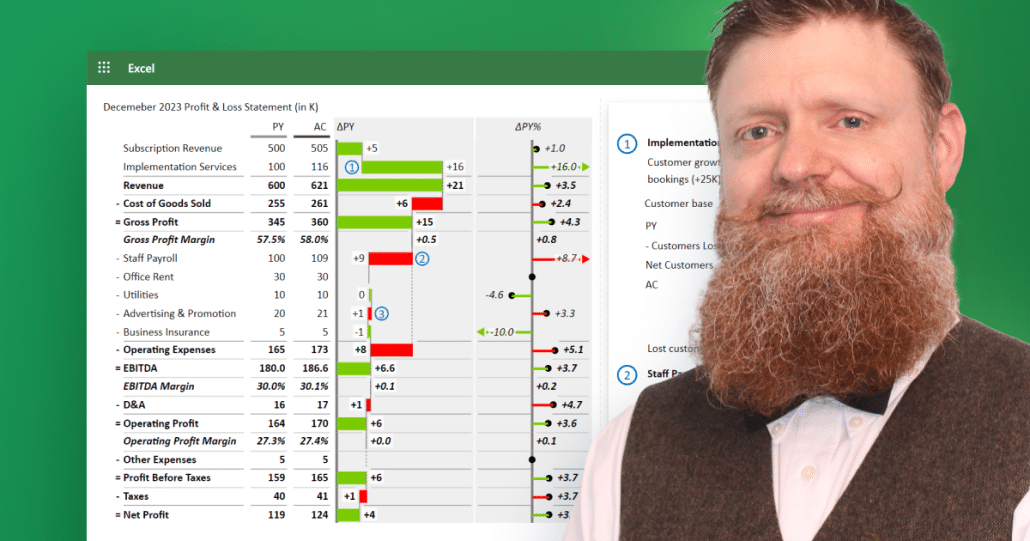
Get a better grip of your annual statements across multiple years and regions -- all in a clean, actionable way even business stakeholders outside of the Financial Department can decipher.
Modern CFOs are moving beyond spreadsheets to lead with data. In this webinar, you’ll learn how Power BI and AI are transforming financial reporting—turning static numbers into strategic insights.
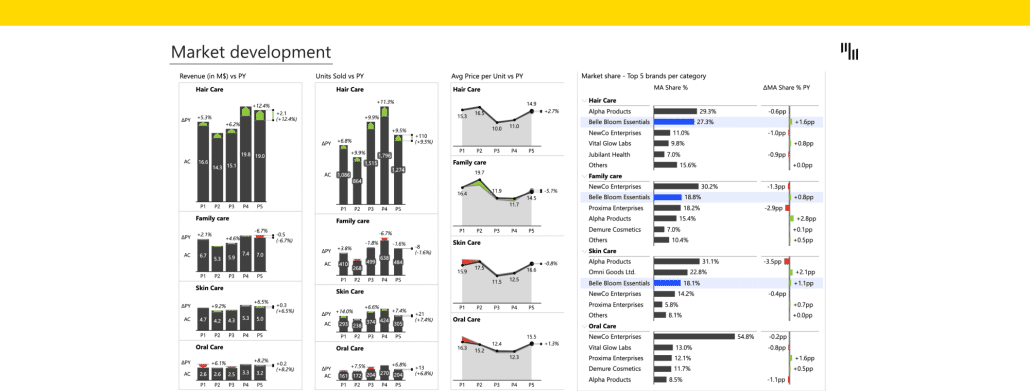
Optimize your FMCG brand's performance with our Brand and Product Portfolio Analysis Dashboard. Perfect for executives and planners, it assesses revenue, market share, and units sold to drive strategic growth and market competitiveness.
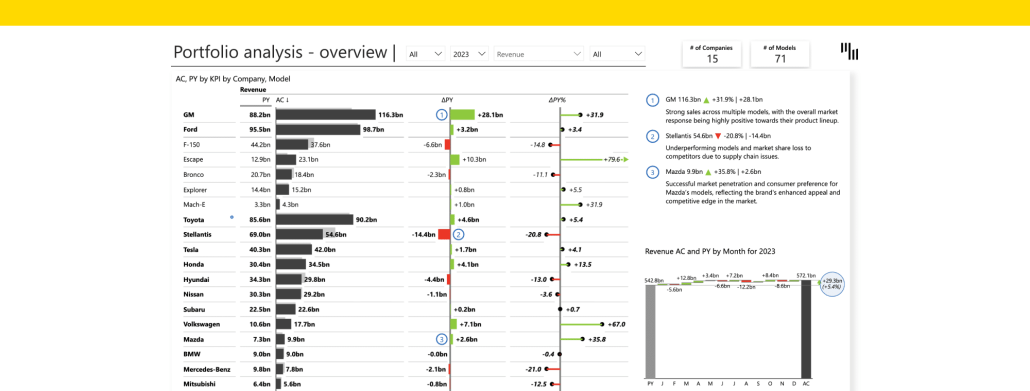
Optimize your automotive brand's performance with our Brand and Product Portfolio Analysis Dashboard. Perfect for executives and strategic planners, it evaluates key metrics like revenue, market share, and sales volume to drive growth.
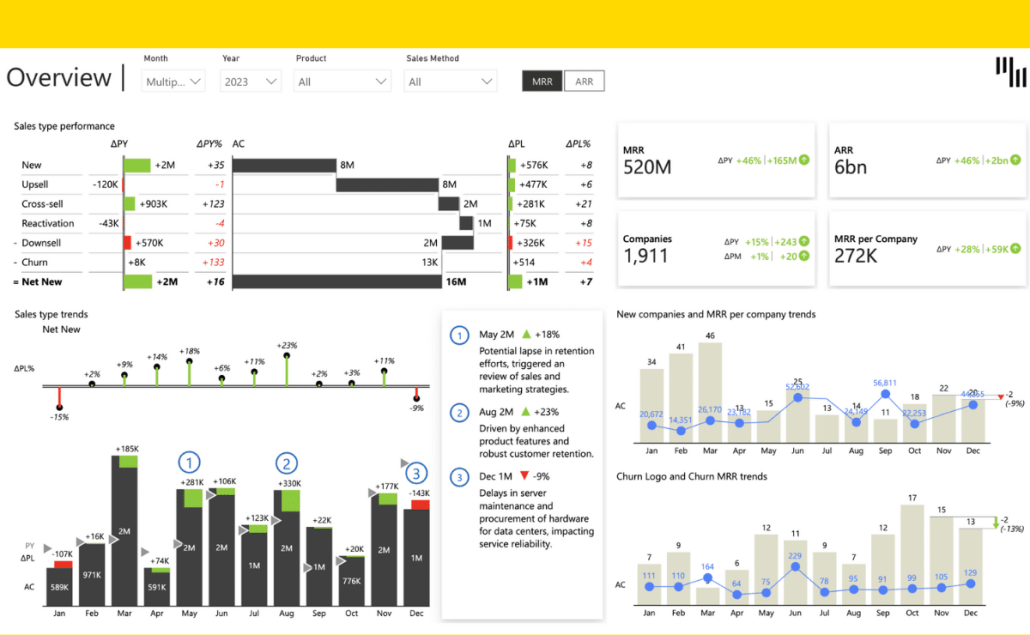
Quickly understand your sales trends with the Zebra BI SaaS Sales Power BI Dashboard. This dashboard provides instant insights into MRR, sales by type, and manager performance, helping you make informed decisions fast.
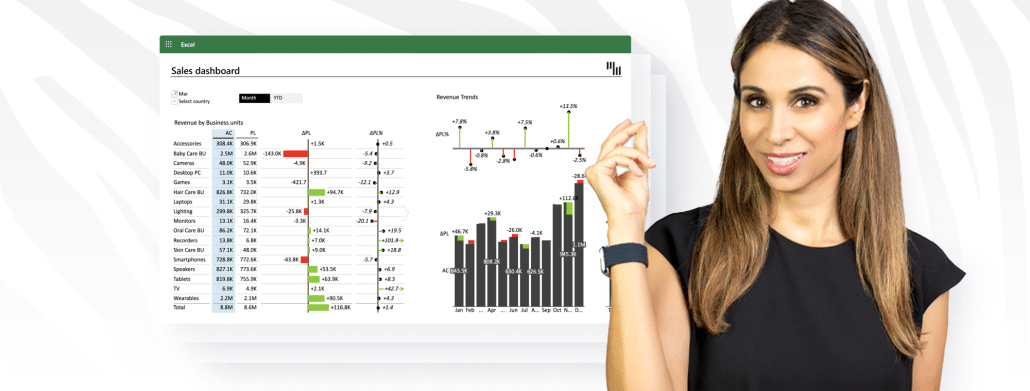
Discover key tips for Excel dashboard creation with Leila Gharani's tutorial and enhance your skills using Zebra BI's advanced tools for optimal analysis.
 September 8th
 February 22nd