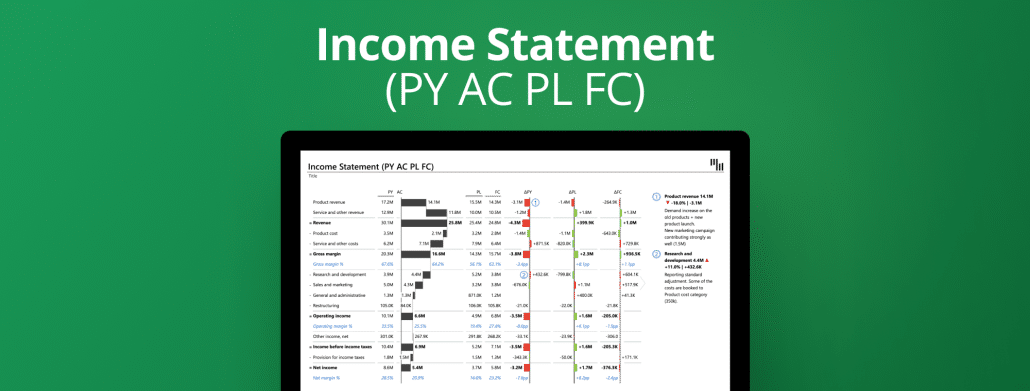
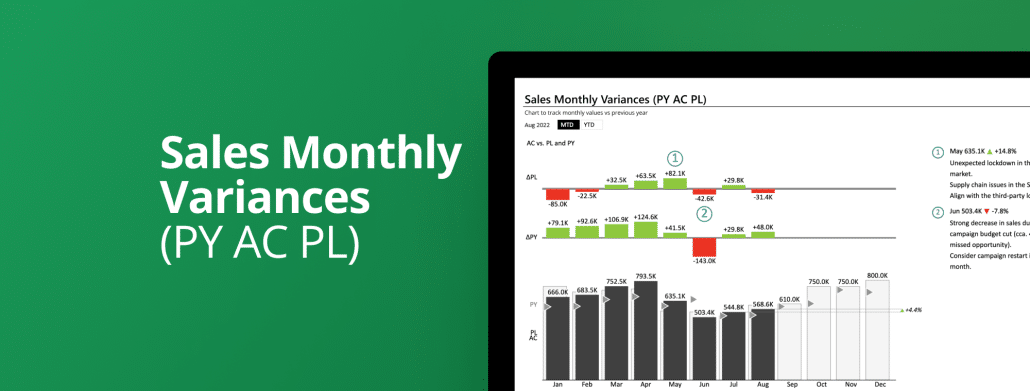
Advanced P&L in Excel with 3 comparisons: previous year, plan, and forecast visualized in one table with a waterfall chart, automatic variances & dynamic comments.
More advanced income statement comparing the actual value with the previous year and the plan in a table with an integrated waterfall chart, custom calculations, and more!
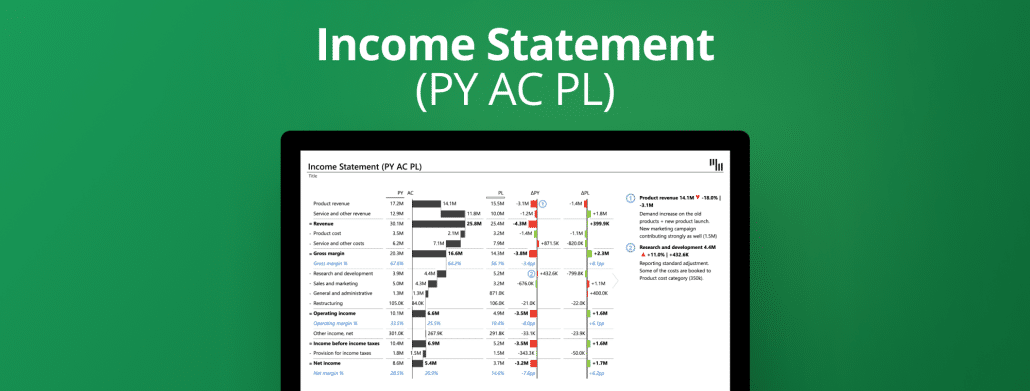
Visualize your P&L in Excel by comparing your actual value to the previous year using a table with integrated waterfall chart, custom calculations, automatically calculated variances, and more!
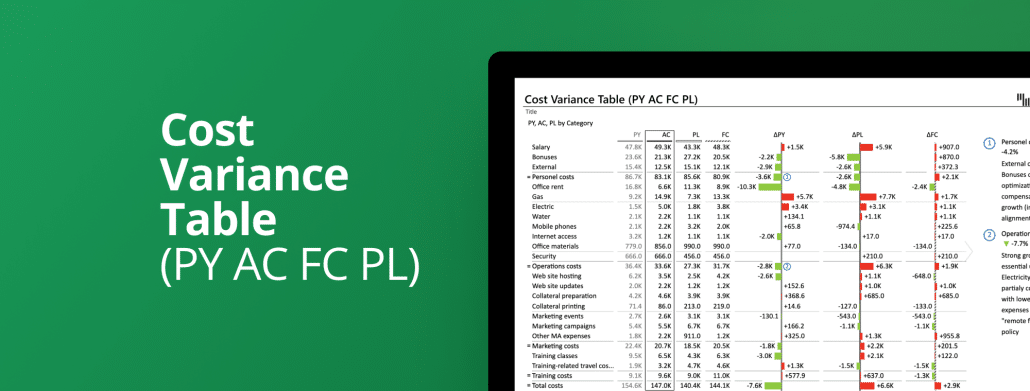
Next-level visualization of different costs with three comparison measures in one table: the previous year (PY), forecast (FC), and plan (PL). Add dynamic comments for more insights.
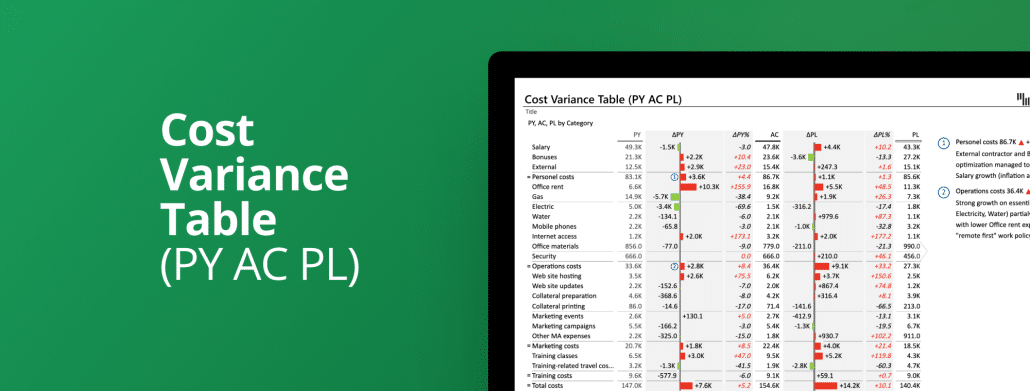
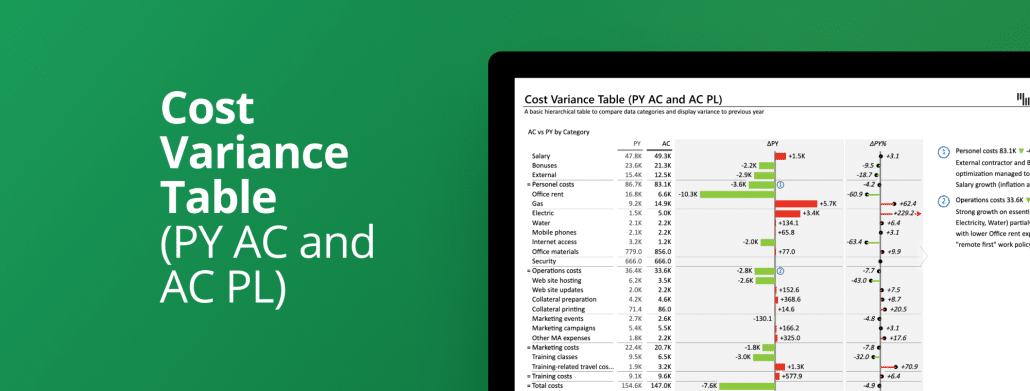
Display different costs with absolute and relative variance. Compare the actual (AC) value with the previous year (PY) and plan (PL) in the same table and add dynamic comments for more insights.
Show different costs compared to the previous year or plan. Use custom calculations or not, display dynamic comments, and visualize variances for more insights.
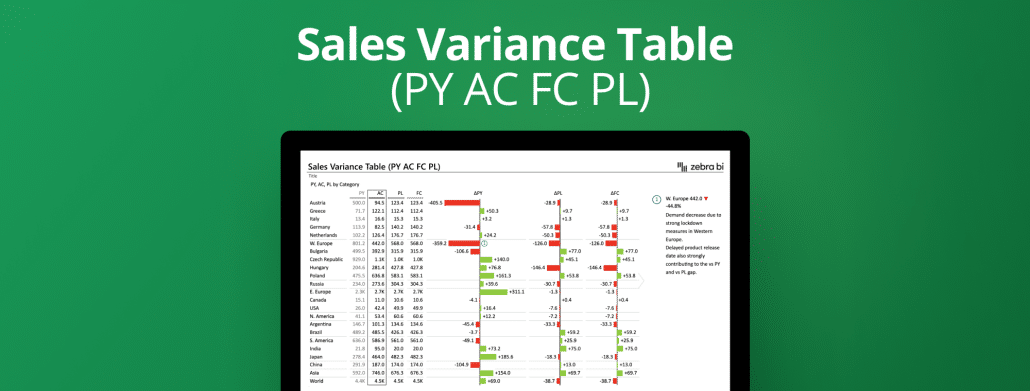
The most powerful template for checking the Market/Country's actual performance in a hierarchical table. You can add up to 3 comparisons at the same time (plan, previous year, and forecast) with automatically calculated variances and integrated dynamic comments.
Check the Market/Country's actual performance in a hierarchical table by adding 2 comparisons at the same time (plan and previous year). Zebra BI automatically calculates the variances and lets you add dynamic comments for more context.
This template shows Market/Country performance in a hierarchical table. It is a simple comparison of two measures (actual and plan or actual and previous year) with automatically calculated variances and integrated dynamic comments.
 September 8th
 February 22nd
 23 May 2024