December is here and we’ve been so busy working on exciting new projects (hint, hint!) we’ve almost missed it. So before we say goodbye to 2022 and focus on the challenges ahead, let’s just take a moment to reflect on where we’ve been and what we’ve accomplished, in large part thanks to your support.
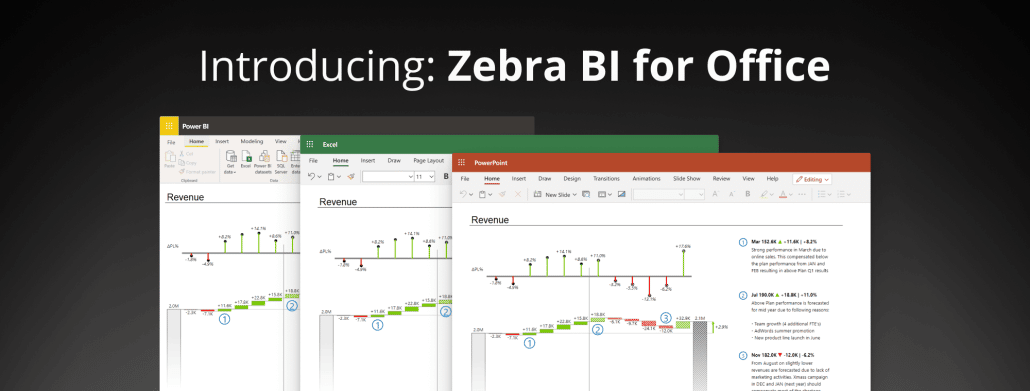
Creating waterfall charts used to take tons of work. Well not anymore! With Zebra BI for Office, you can do it with just a few clicks. Hear all about it from Chandoo himself.
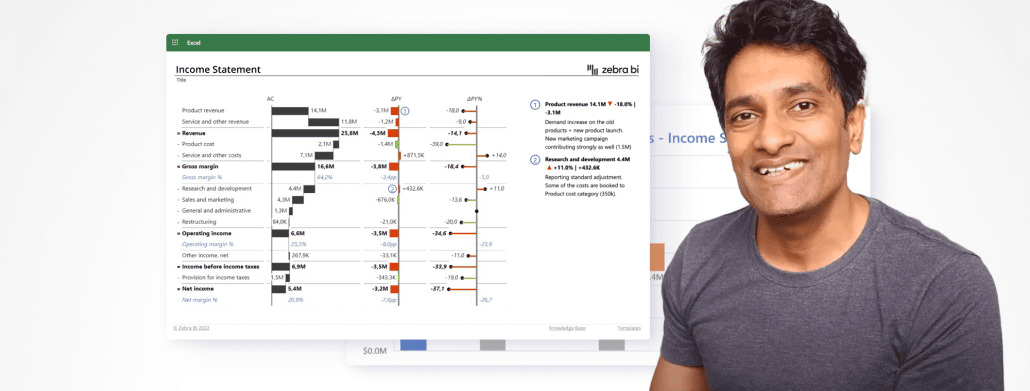
Yes, you heard right! Advanced visualizations in Excel & PowerPoint are no longer a myth! With the help of Zebra BI for Office Chandoo created a long awaited Budget vs. Actual Chart, that can impress even the strictest managers.
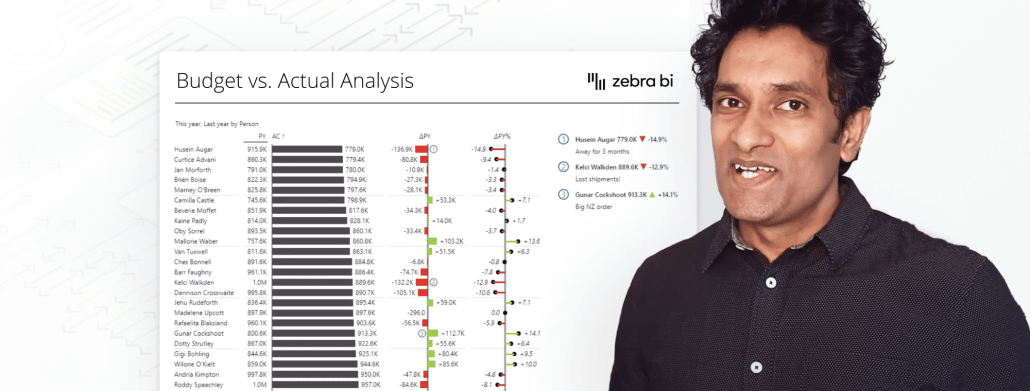
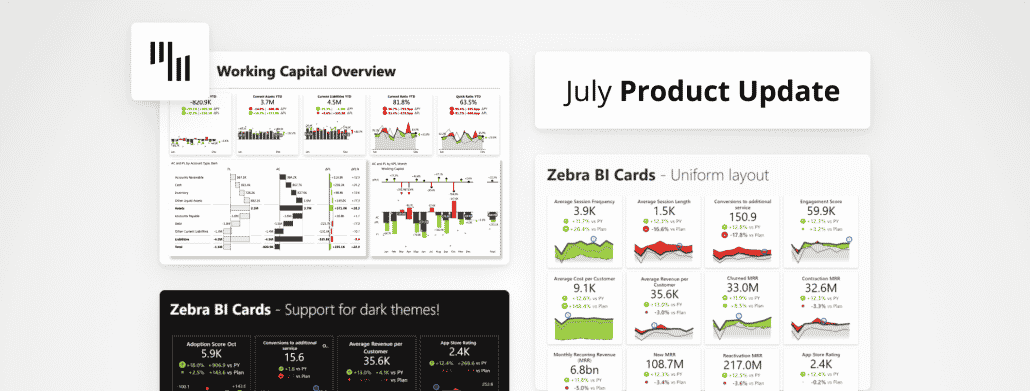
July brings some exciting announcement to the Zebra BI users. Learn more about the upcoming new release of Zebra BI Charts & Cards, and discover the new template for Power BI!
 September 8th
 February 22nd
 23 May 2024