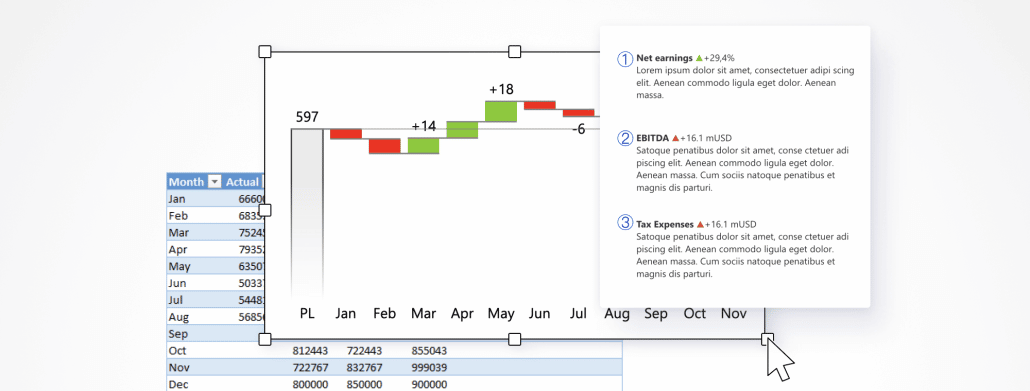
Use this template to visualize your P&L in Excel with multiple levels using expand & collapse functionality in a table with integrated charts. Get the right context with automatic variances & up to three comparisons.
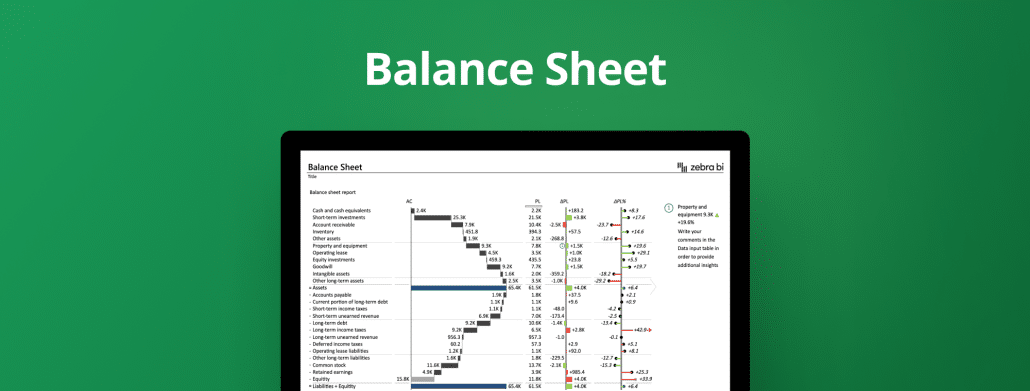
Visualize your company's financial position with table with integrated waterfall chart, custom calculations for invert & result, dynamic comments & automatic variances so that everybody know what is going on & why.
Use a bridge chart to display the performance of your business. Adding custom calculations (e.g., invert, result), dynamic comments & automatic variances you will get additional insights.
Use this template in Excel to visualize the performance of different marketing areas with a bridge chart and identify who is performing according to plan, and who is not, and learn why.
Create an Income statement (P&L) in Excel using a bridge chart, custom calculations (e.g., invert, result), dynamic comments, and automatically calculated variances.
Use this template to visualize your EBIT contribution analysis with a bridge chart directly in Excel. Automatically calculated variances & dynamic comments provide even more insights for you & your managers.
Visualize how Cash Flow from Operations, Investment & Finance contributes to Net cash flow by using a table with integrated charts, comparing actual to plan & previous year, and showing more insights with dynamic comments.
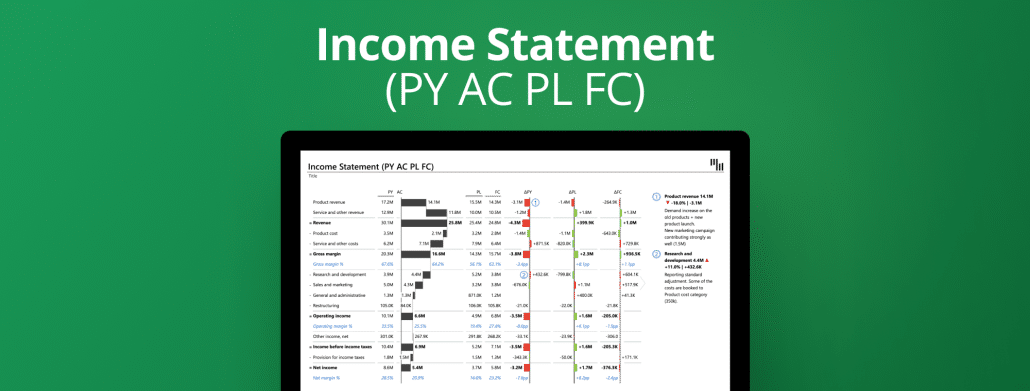
Advanced P&L in Excel with 3 comparisons: previous year, plan, and forecast visualized in one table with a waterfall chart, automatic variances & dynamic comments.
 September 8th
 February 22nd
 05 Mar 2026