🔥 Black Friday Offer at Zebra BI
Explore the offer

Product: Excel

September 6, 2016
Improve your Excel reports with visual highlights
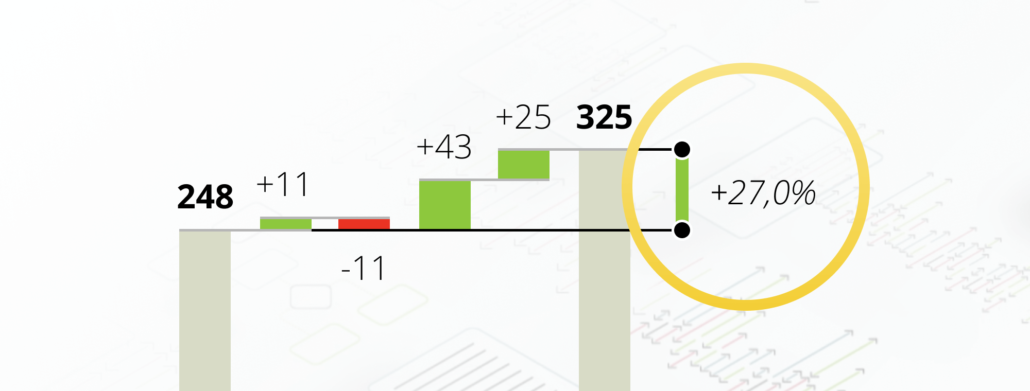
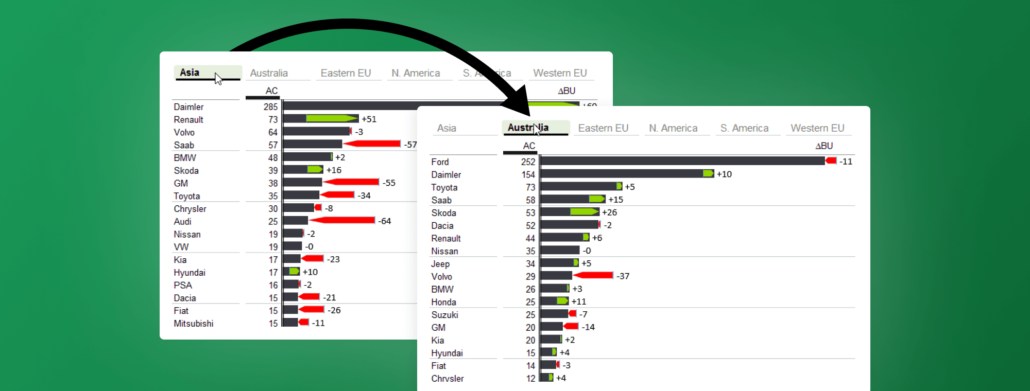
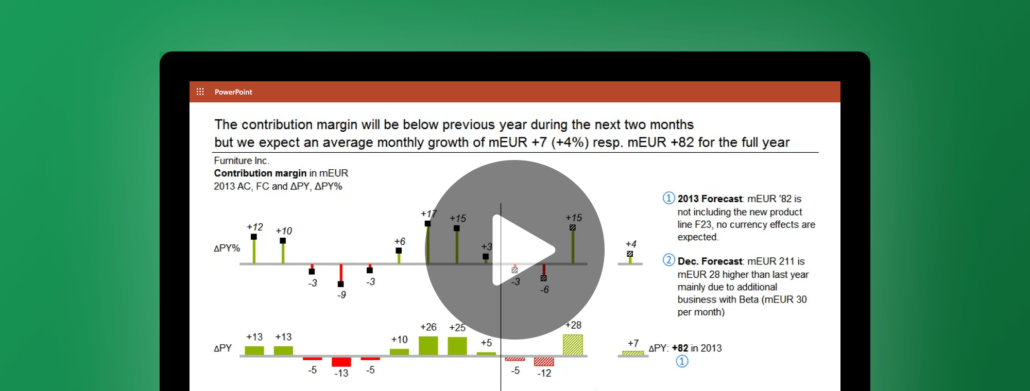
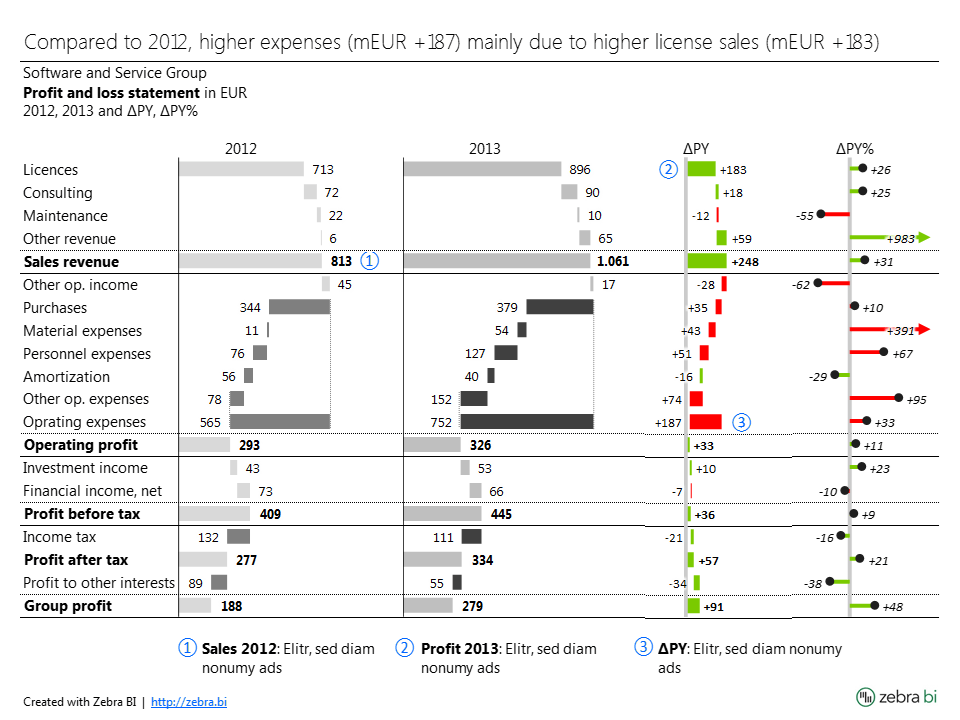
The ideal tool for bringing clarity to your reports and showcasing key information faster are visual highlights. Learn how this can be done easily with Zebra BI!
August 18, 2016
Difference highlight: the fastest way to improve your reports and dashboards
Good data visualization removes all unnecessary items and emphasizes the important values. One of the best tools for this is a difference highlight.
July 7, 2016
How to create interactive reports and dashboards in Excel
Updating your monthly, weekly and daily reports in Excel can be a tedious task. Fortunately, you can use some of the native Excel functions to automate it.
June 29, 2016
Automating Excel reports with PivotTables and slicers
MS Excel offers PivotTables, slicers and other functions that let you automate your reports and dashboards in an extremely efficient way. Learn how!
June 15, 2016
Creating updatable PowerPoint presentations
Learn how to export your tables, charts or even whole reports from Excel to PowerPoint and make them update automatically.
May 11, 2016
How to Design Income Statements (Profit & Loss Statements) in Excel
In need of some guidance on how to redesign the income statements to make them actionable, understandable and compliant with IBCS standards?
April 20, 2016
The Definitive Guide to Waterfall Charts
Waterfall charts are one of the most powerful tools of every business analyst. Get all the knowledge about them and some ideas for future reports!
April 5, 2016
How to Create Efficient Variance Reports
Learn how to design efficient variance reports to track the actual performance against your company goals with the help of Zebra BI.
March 24, 2016
Top 3 Ways to Report your Variance Analysis in Excel
There are a couple of different ways to perform variance analysis. Learn how to easily do it in Excel in 3 ways and improve your reporting.

Pagination