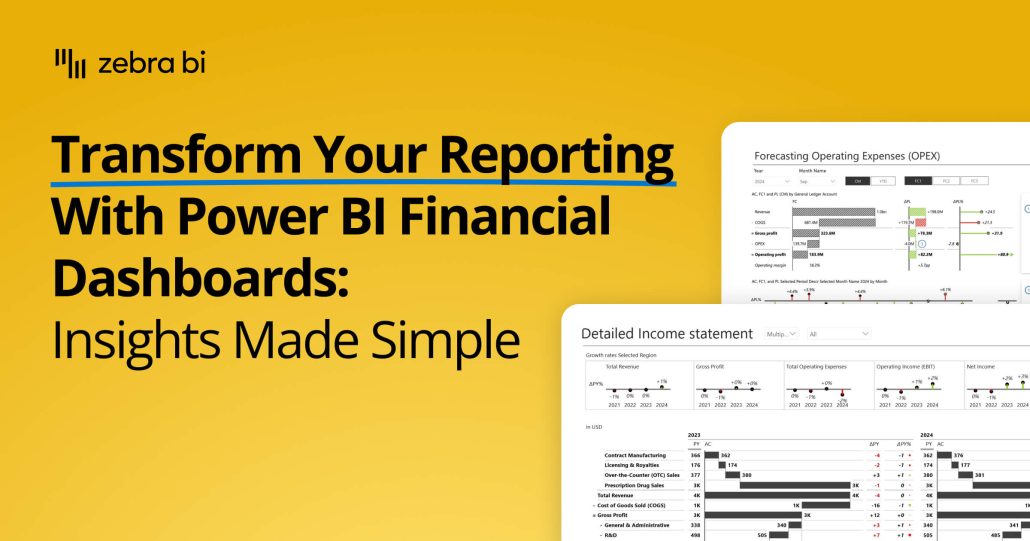
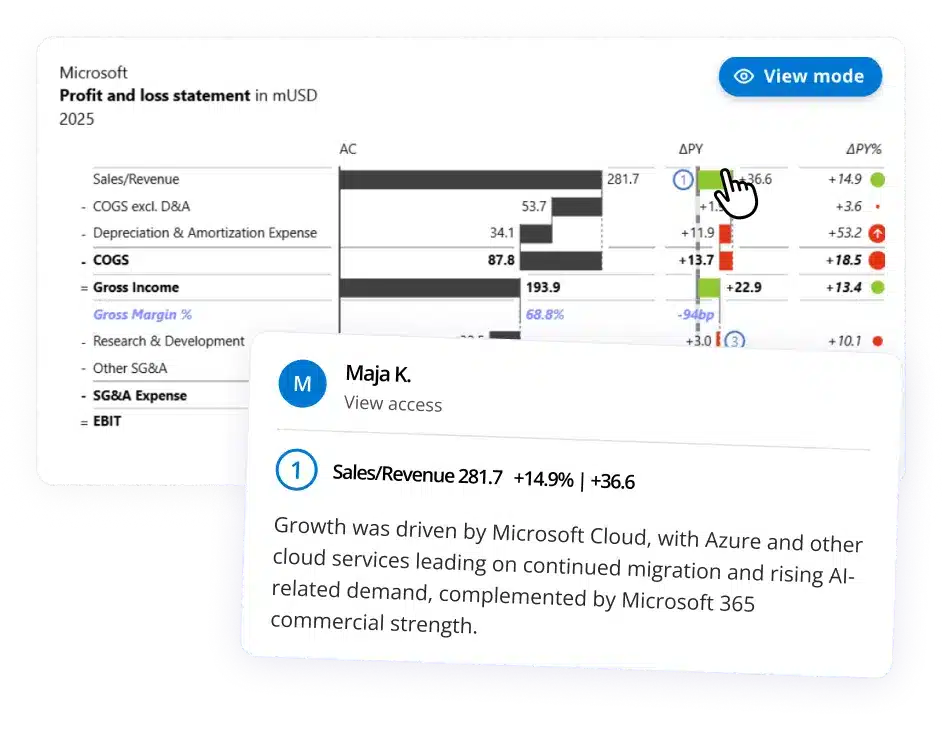
Transform your financial dashboards in Power BI. This guide shows you how to build lean, insightful reports for P&L, trend analysis, and cost management.
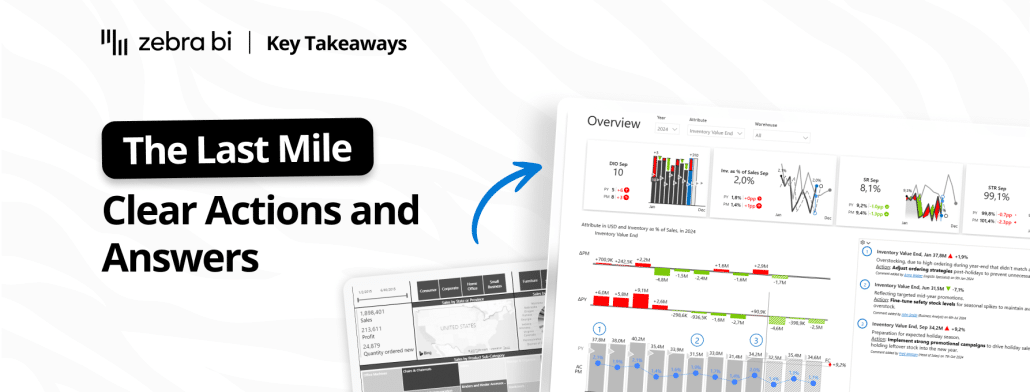
Eighty percent of BI investments fail to change a single decision. The gap between dashboard and decision has a name: the last mile of analytics. Inside: the four-question test from our Part 2 webinar, and two finance teams (Heijmans and Ipsen Pharma) who actually crossed it.
Kosten omlaag, opbrengsten omhoog. Zebra BI en Den of Data laten zien hoe je data centraliseert in een managed dataplatform en rapporteert volgens IBCS-standaarden, zodat dashboards direct tonen waar actie nodig is. Nu on demand te bekijken.
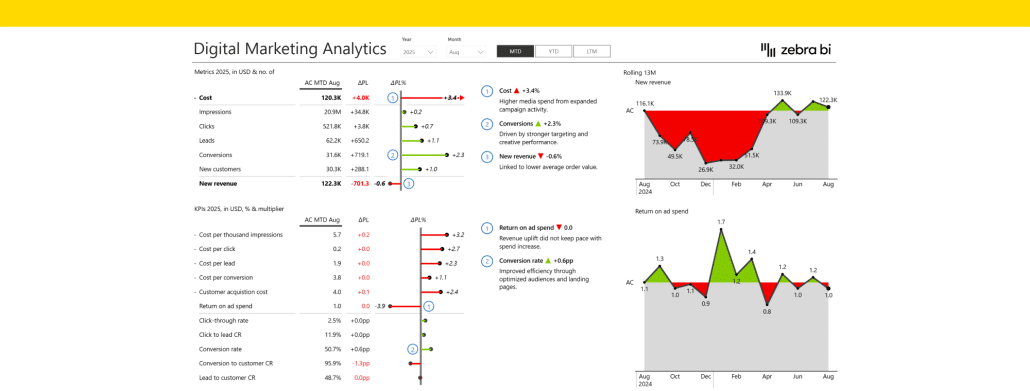
Marketing Performance Dashboard Template in Power BI to help you analyze channels, campaigns, funnel metrics, efficiency KPIs, and marketing ROI in one view.
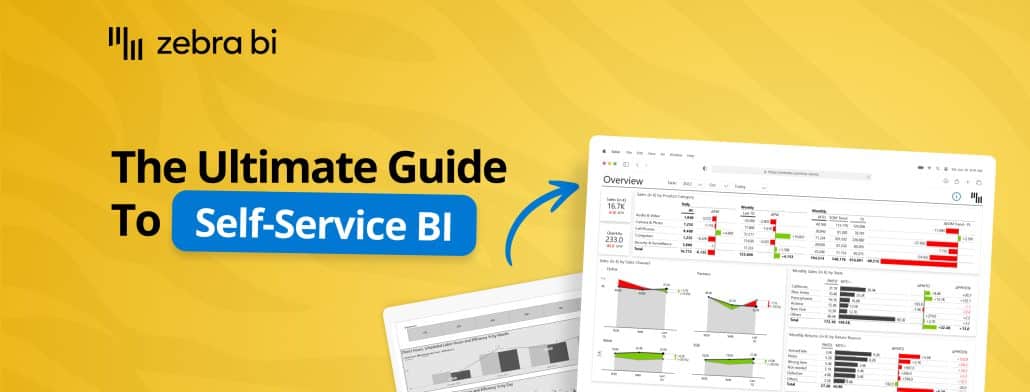
Want to learn how to turn your sales dashboard into a true power house of insights, using Power BI? There's an easy way and our Lead BI consultants explained it in this webinar.
Join our live webinar to learn how to use Zebra AI to turn raw finance and business data into executive-ready dashboards that help Controlling & FP&A teams explain performance.
 September 8th
 February 22nd
 27 Oct 2026