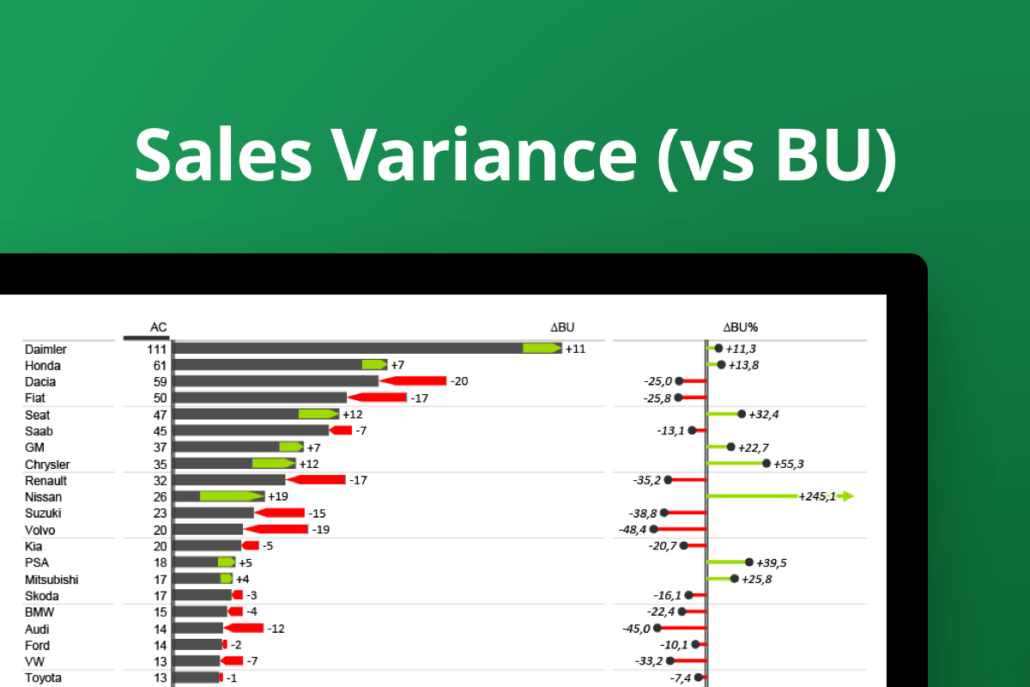
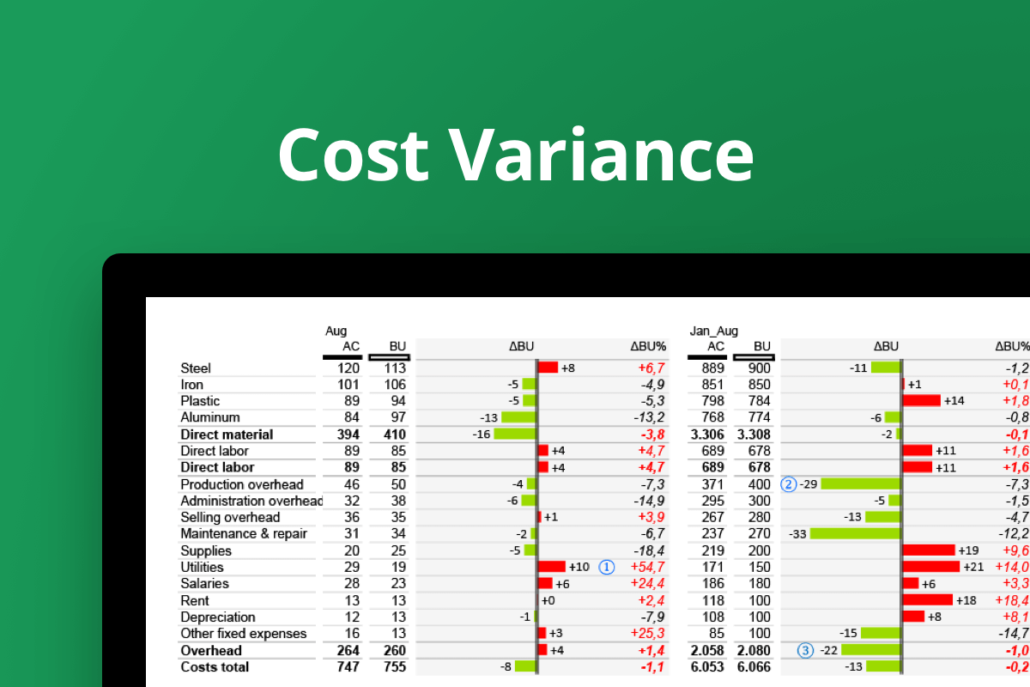
This Excel template uses vertical integrated variance chart to visualize AC and BU data. It also features vertical lollipop chart to display relative AC vs BU variance.
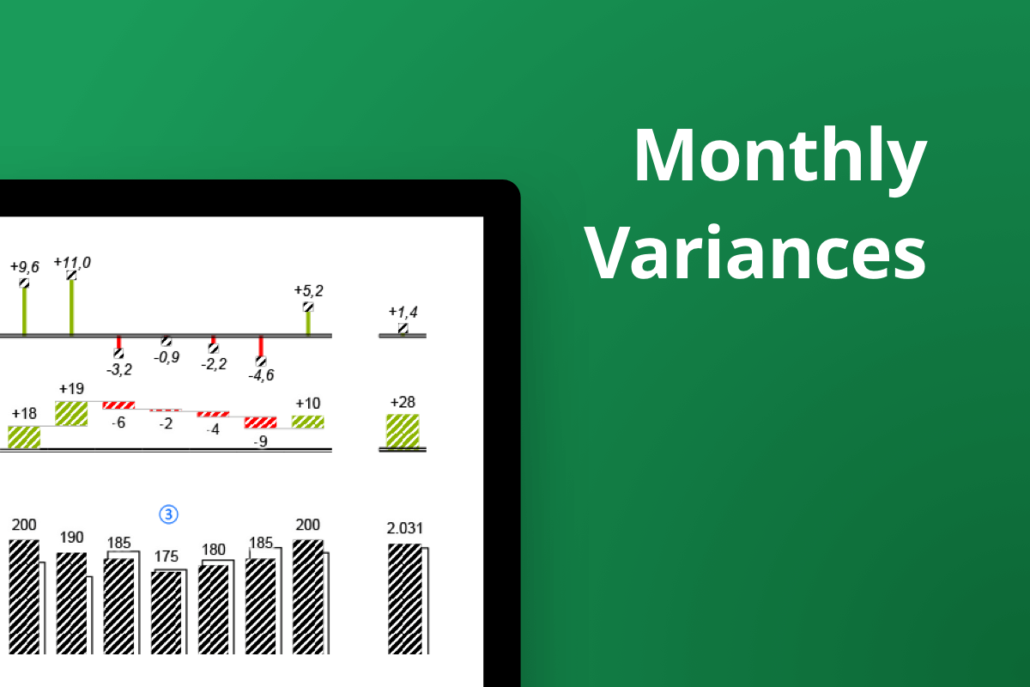
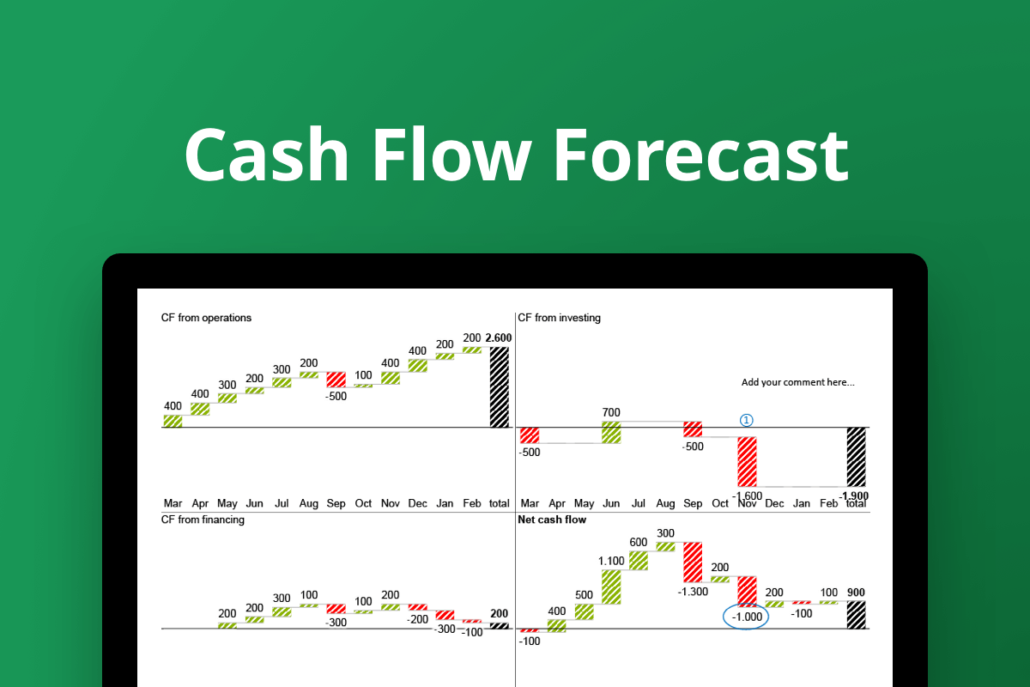
This Excel template visualizes monthly and year-to-date AC, FC and BU data featuring absolute and relative variances (using a waterfall and lollipop chart).
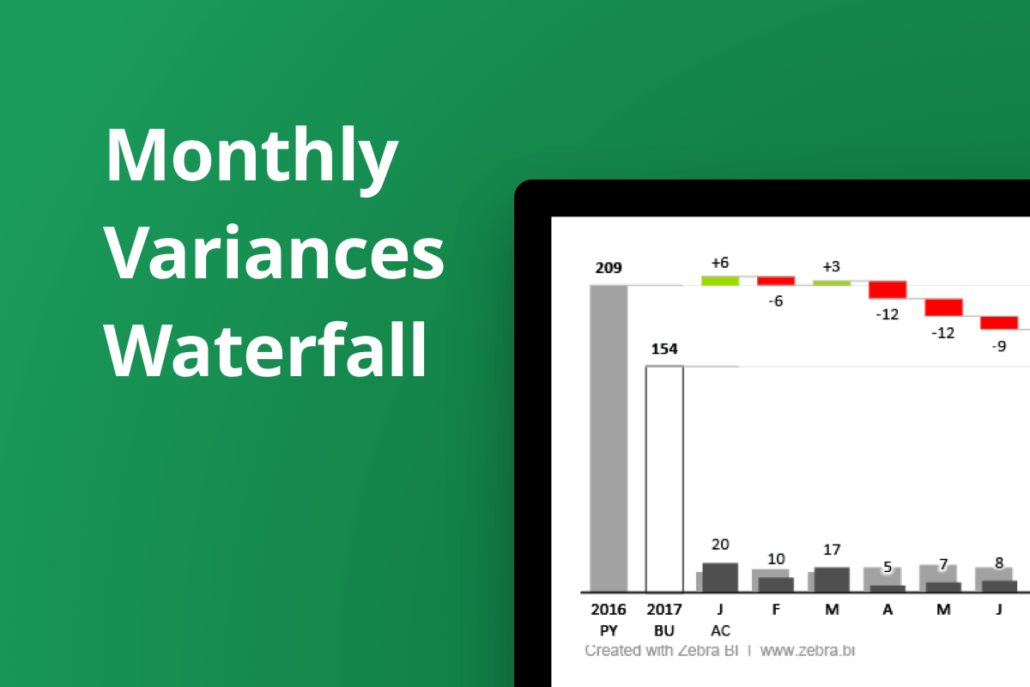
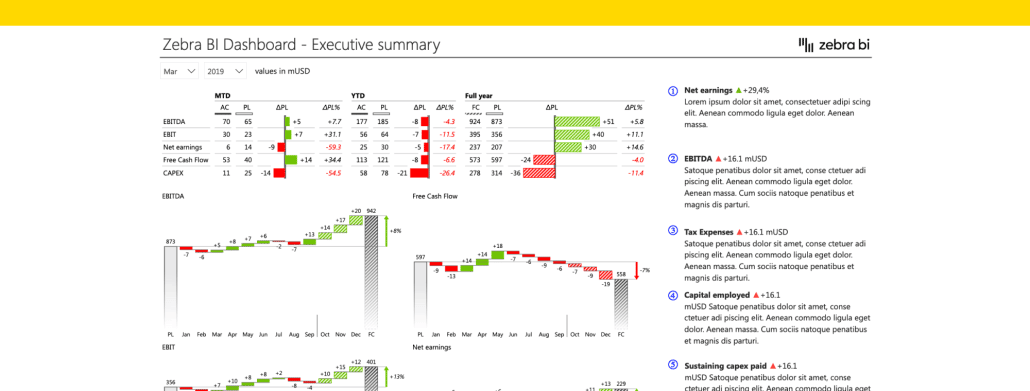
This Excel template visualizes monthly data for AC, PY, BU and FC, displaying absolute variances (waterfall chart) and relative variances (lollipop charts).
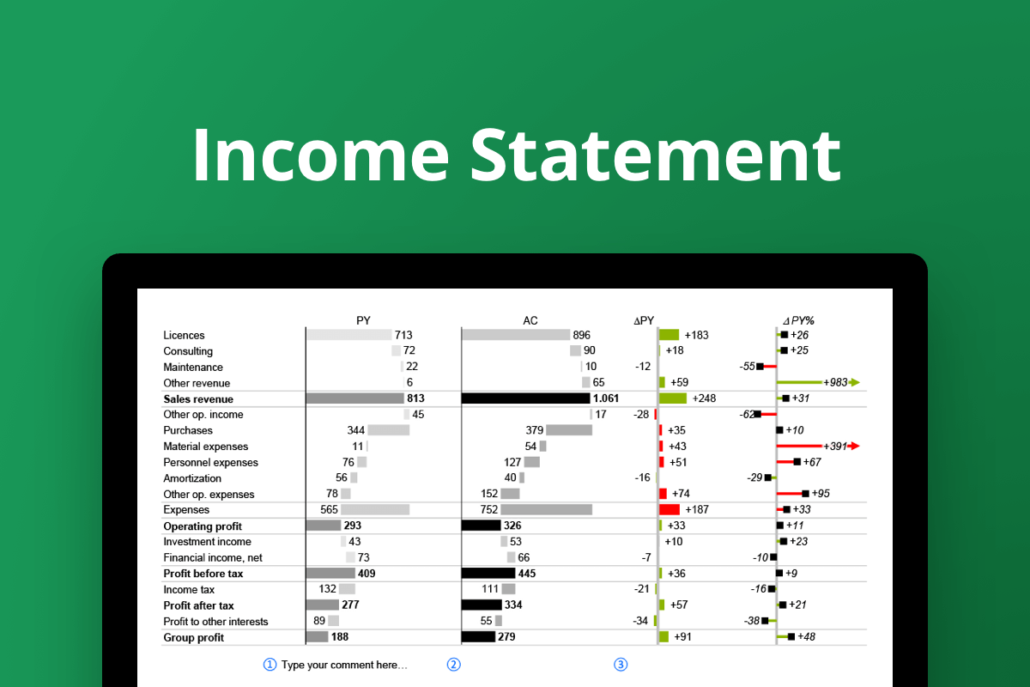
This Excel template allows you to visualize your Profit & Loss data for current and previous year using vertical waterfall charts, absolute and relative variance charts.
 September 8th
 February 22nd