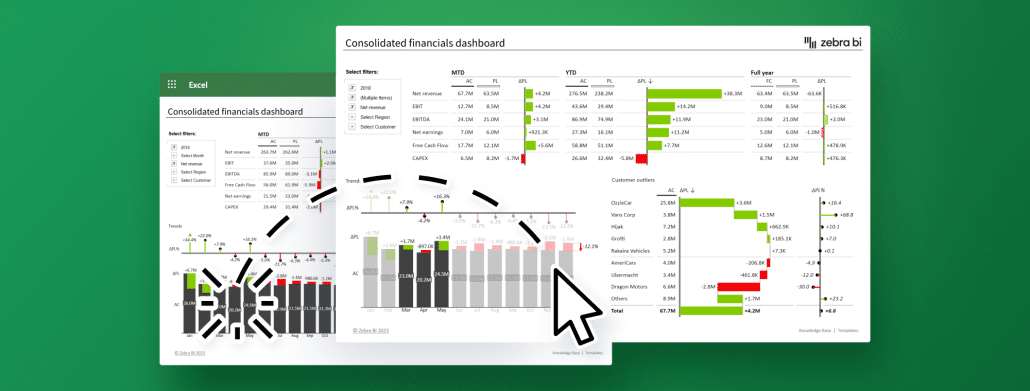
Explore Cross-Visual Filtering in dashboards. Enhance interactive data analysis in Excel & Power BI for sharper insights and informed business choices.
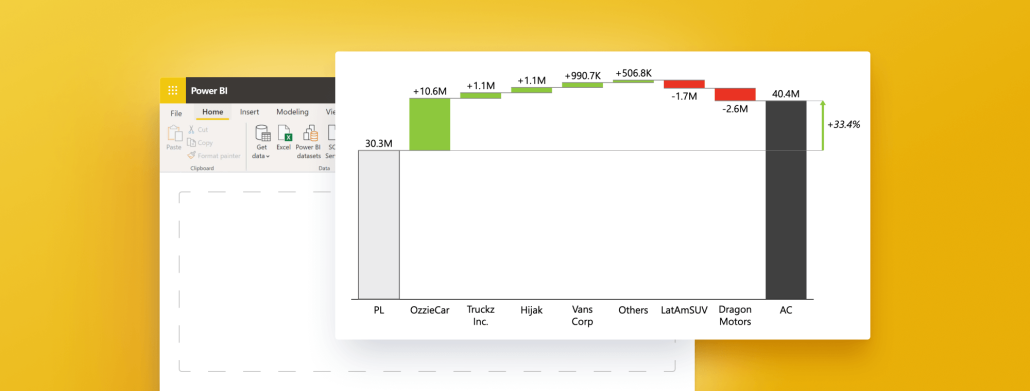
Need to understand waterfall charts (and quickly)? This guide explains everything you need to know about Power BI waterfall charts and their main use cases.
 September 8th
 February 22nd
 05 Mar 2026