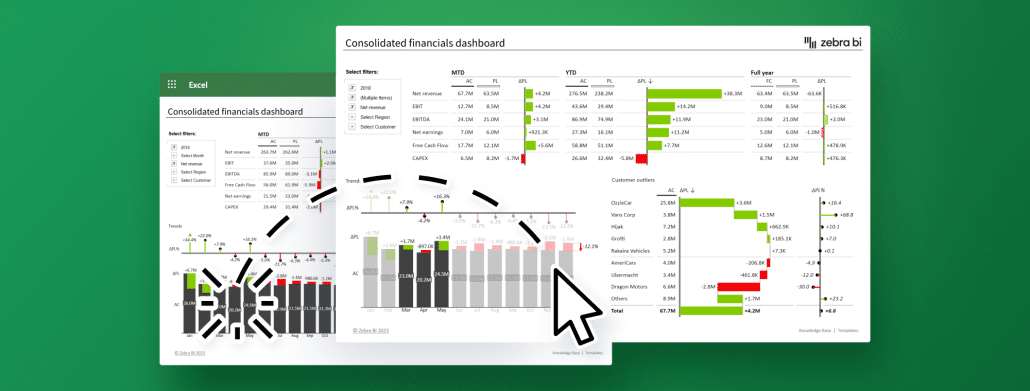
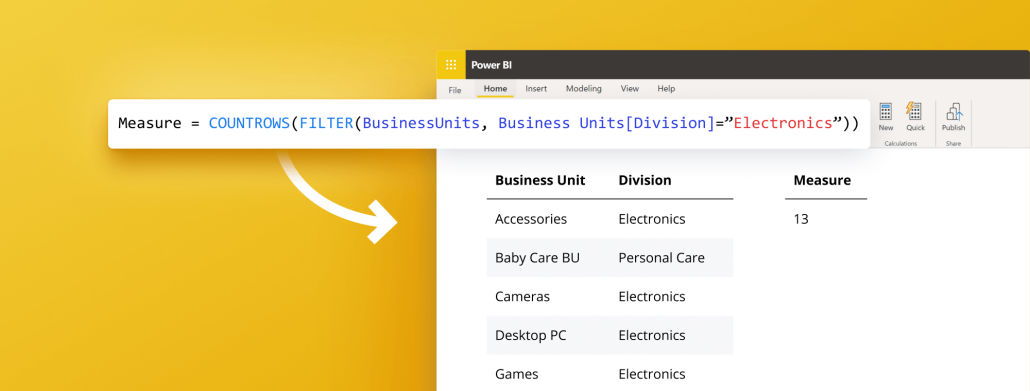
This webinar is all about financial analysis in Power BI. Take a look at the performance of some of the biggest Fortune 500 companies and use these practical examples to apply them to your data. Don't just create reports, generate insights.
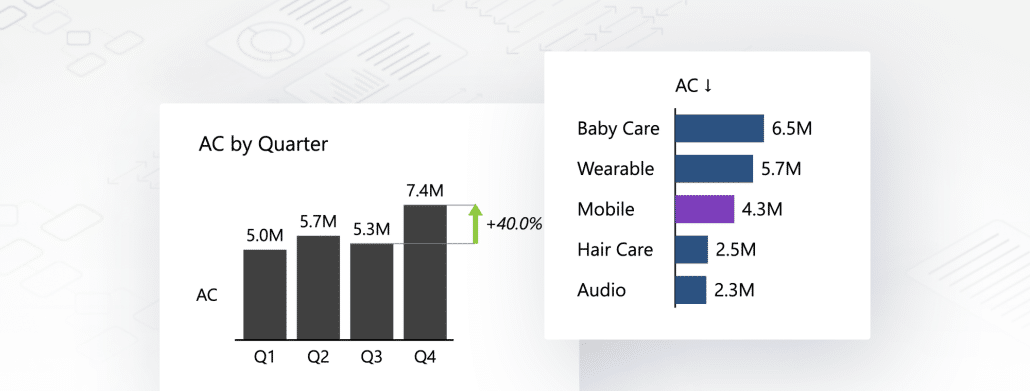
Explore Cross-Visual Filtering in dashboards. Enhance interactive data analysis in Excel & Power BI for sharper insights and informed business choices.
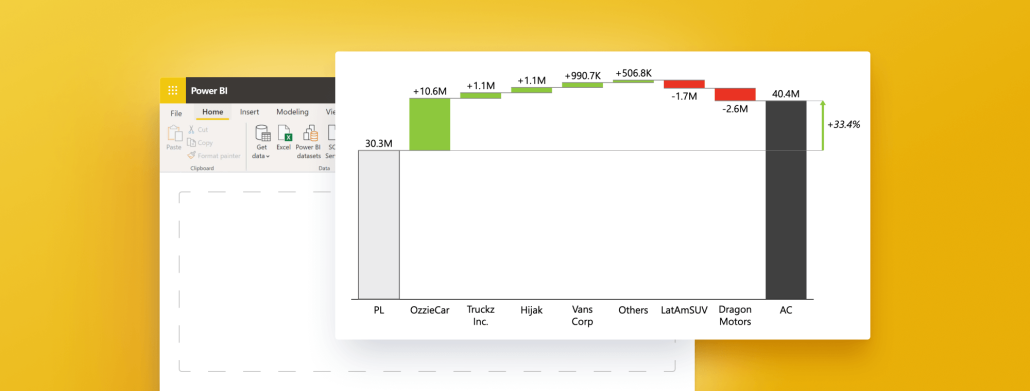
Need to understand waterfall charts (and quickly)? This guide explains everything you need to know about Power BI waterfall charts and their main use cases.
 September 8th
 February 22nd