Webinar recording
From Data to Decisions: Real-Life Fortune 500 Financial Analysis with Power BI

Watch the on-demand recording to compare the performance of some of the Fortune 500 companies:

  • Watch how to create financial analyses on publicly available data that will reveal who is doing better: Walgreens vs Walmart, General Motors vs Tesla, Coca-Cola vs Pepsi, and Nike vs Adidas
  • Learn what it takes to create financial analyses in 2023 that match the needs of the fast-changing financial space where it's no longer just about data
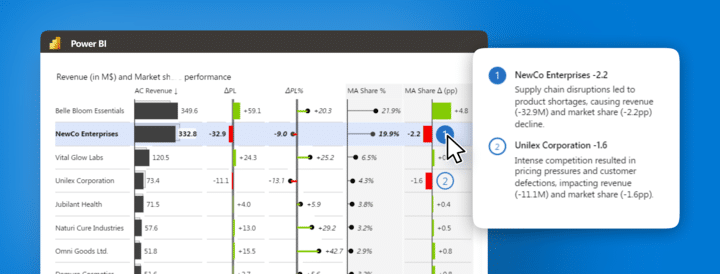
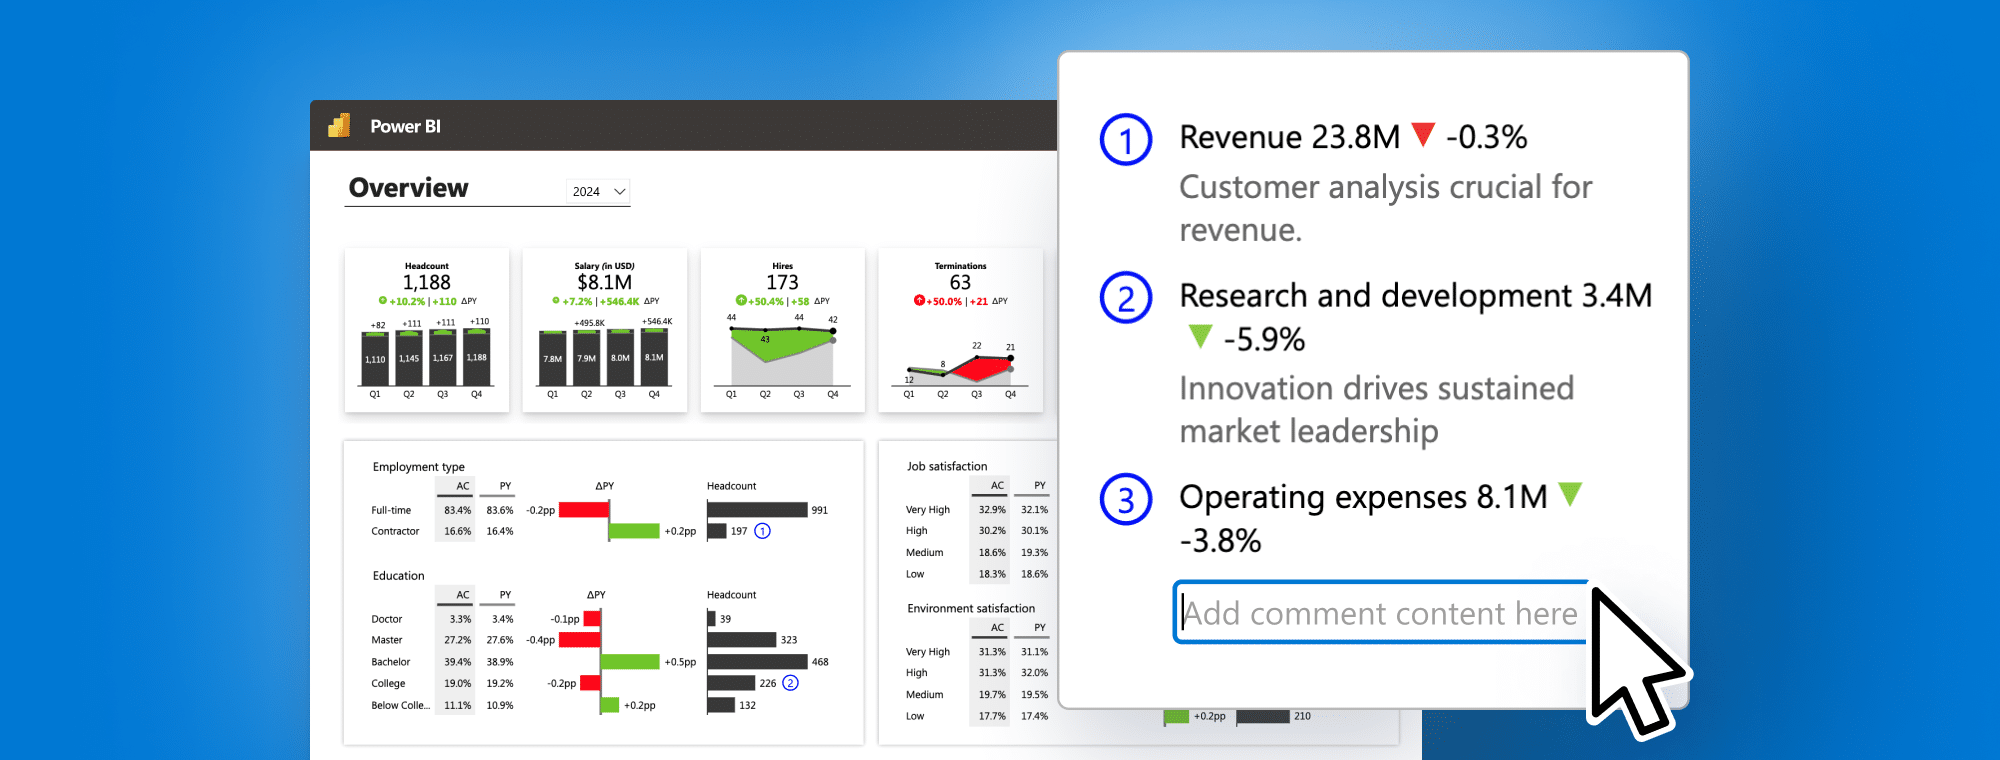
  • See how easily you can implement a waterfall chart, hierarchical table, multiple comparisons, automatically calculated variances, integrated dynamic comments, and more.

It's time to start creating interactive reports that will immediately reveal performance and help you decide on future actions.

What's included

Full video recording
Demo files used in Webinar
Enjoy & thank you for watching! Don't hesitate to reach out if you have any questions — write to us at support@zebrabi.com!

Presenter

Andrej Lapajne

Founder & CEO at Zebra BI

Watch the Video

Get demo files used in webinar
You can download Demo files used in webinar.
Access the materials
AGENDA
00:00:00 Start
00:00:40 Intro
00:09:57 Financial benchmarking playbook
00:14:13 Scrape data from WSJ (PowerQuery)
00:20:49 Prepare financial model in Power BI
00:25:55 Visualize, calculate margins (Zebra BI visuals)
00:39:20 Scrape brand logos from Brandfetch
00:42:28 Benchmarking analysis (Zebra BI visuals)
00:57:57 Calculate financial KPIs (DAX)
01:07:24 Key takeaways
01:10:57 Q&A
01:29:00 Wrap up
Share this

Your Questions

Here are some of the questions that came up during our live session. Thank you for being such a proactive audience. Have more questions? Drop us a note at support@zebrabi.com!
What is the advantage of Power BI vs PowerPivot?

Working with the data is pretty similar, however in terms of visualizing the data and distributing it as a single-source of truth. Power BI/Power platform has really advantageous capabilities. From interactivity, all sorts of drill operations and just maintenance of Reporting infrastructure.

If you are interested - you can learn the basics for free by joining Zebra BI Academy.

Can you import multiple tables per company, or is it better to pull multiple companies at once?

You can pull multiple tables from different URLs at once. In this webinar however, we scraped it per Financial statement per Company and simply appended them one below another.

Can Zebra BI visuals help improve a company's financial analysis?

Absolutely! The usage of Zebra BI visuals, can help you understand your data with better clarity as they follow the best practices of IBCS (International Business Communication Standards).

How can I include comments on the Zebra BI Cards?

The principle is the same as in Zebra BI Charts and Zebra BI Tables visuals. You can include them by just dropping it in the "Comments" placeholder.

However, it will only be shown with full text if you focus the card - we will add the Comment box to Zebra BI Cards in the future.
Ready to start uncovering actionable insights from your data?

Explore Zebra BI for Office and Power BI, or start a trial instantly and test our tools on your data. You can also contact us to help you build your first test report and create a custom package for your business.

More Trending Webinars

May 23, 2024
Mastering Brand and Product Portfolio Analysis in Power BI
Join our webinar to explore the easiest way so far to do dynamic commentary in Power BI for clearer insights, quicker decisions, and smoother meetings.
Watch now
April 18, 2024
Commentary Revolution: Transforming Power BI Dashboards with Dynamic Comments
Join our webinar to explore the easiest way so far to do dynamic commentary in Power BI for clearer insights, quicker decisions, and smoother meetings.
Watch now
New
PowerPoint
October 26, 2023
How to create board meeting PowerPoint slide decks like a consultant in 2023
After gathering all the data you need it's time to present it effectively to your managers. And this doesn't mean using many different shapes and colors that tell nothing. Learn practical tips for a professional-looking and actionable PowerPoint slide deck.
Watch now
May 11, 2023
Zebra BI for Office 2.0 is now available!
Learn how to create stunning, interactive Excel dashboards that provide immediate answers to your business questions and showcase your performance in a visually compelling way. Share your results easily and take your reporting to the next level, whether you're a seasoned BI pro or a passionate Excel enthusiast!
Watch now
March 9, 2023
Must-Know Tricks For Interactive Excel Dashboards in 2023
Learn how to create stunning, interactive Excel dashboards that provide immediate answers to your business questions and showcase your performance in a visually compelling way. Share your results easily and take your reporting to the next level, whether you're a seasoned BI pro or a passionate Excel enthusiast!
Watch now
PowerPoint
November 29, 2022
How to convert boring reports into an actionable data story
Reports in Excel & PowerPoint still don't follow the modern reporting best practices. What can you do about it? Start using the new Zebra BI for Office and join this live session to learn some tips & tricks.
Watch now
Browse All Resources