 September 8th
 February 22nd
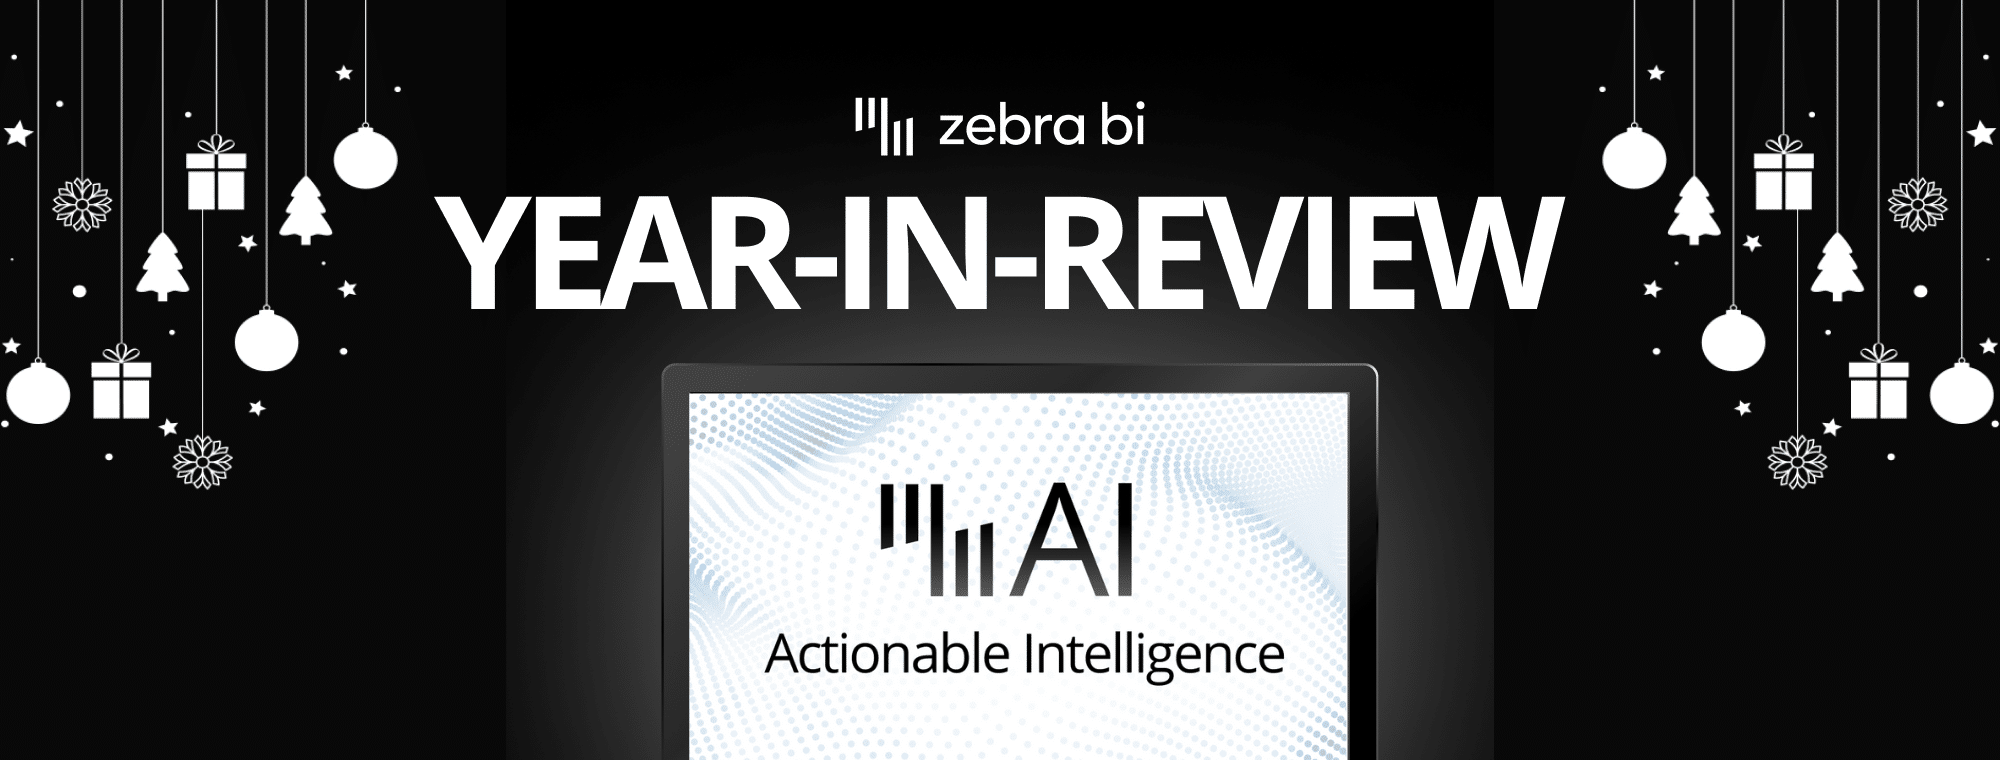
Zebra BI's Year in Review: Let's wrap up 2023
Hello to our valued Zebra BI community! As we wrap up another remarkable year, it's time to reflect on our journey through 2023, a year marked by significant strides in data visualization and business intelligence. This year, we've continued to innovate and evolve, bringing you even more powerful and intuitive tools. It's about making your journey with data not just easier but also more impactful.
Reflecting on our growth, we're overjoyed to share that our community now includes over 1.5 million users from 119 countries. Your enthusiasm and trust in Zebra BI continue to inspire us, and we're grateful for the opportunity to support your data storytelling journey worldwide.
Let's dive into the highlights of how we've elevated your storytelling capabilities in 2023.
Looking for the written scoop on our 2023 highlights? Perfect, then read all about it 👇
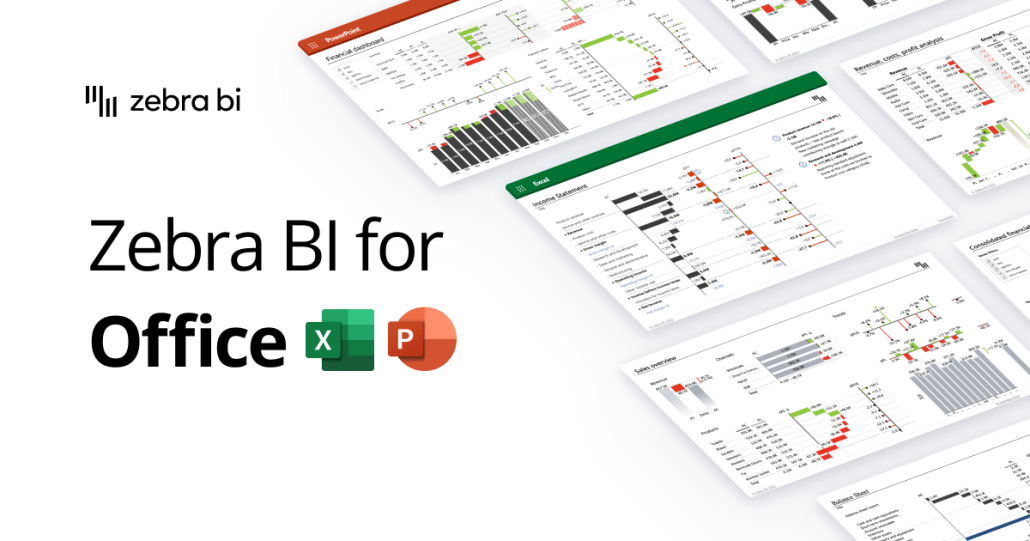
Office 2.0: A New Era in Data Reporting
We proudly launched Office 2.0, a major milestone that redefines how you interact with data in Office. Its intuitive features and seamless integration make data storytelling more accessible than ever.
The launch of Zebra BI for Office 2.0 introduced new features, significantly enhancing Excel and PowerPoint reporting capabilities. Key updates include:
- Cross-Filtering Visuals in Excel: A groundbreaking feature allowing dynamic interaction with visuals for more insightful data analysis.
- Corporate Branding: Simplifies corporate branding application across Excel dashboards and PowerPoint presentations, ensuring consistency in organizational reporting.
- Enhancing Productivity with Data Linking: Enables seamless linking between Excel and PowerPoint, streamlining reporting and boosting automation.
Additionally, these updates have led to increased user engagement, making the Office experience more akin to the dynamic and interactive nature of Power BI. This enhanced synergy between Excel and PowerPoint through Zebra BI for Office 2.0 further empowers you to create more compelling and efficient data stories.
Detailed information on these updates can be found in the live event recording.
Seamless Cross-Platform Experience
This year was pivotal for us as we focused on delivering a seamless cross-platform experience. We understand the importance of integrating various reporting and data presentation platforms. Now, you can create your reports in Power BI, Excel, or PowerPoint – and they will all look and feel the same. Import and keep data sources up to date from Power BI or other data warehouses to Excel and PowerPoint. Single point of truth for faster and easier data consolidation.
As a result, our tools are more connected, intuitive, and user-friendly, which means a smoother workflow that enhances your data storytelling capabilities.
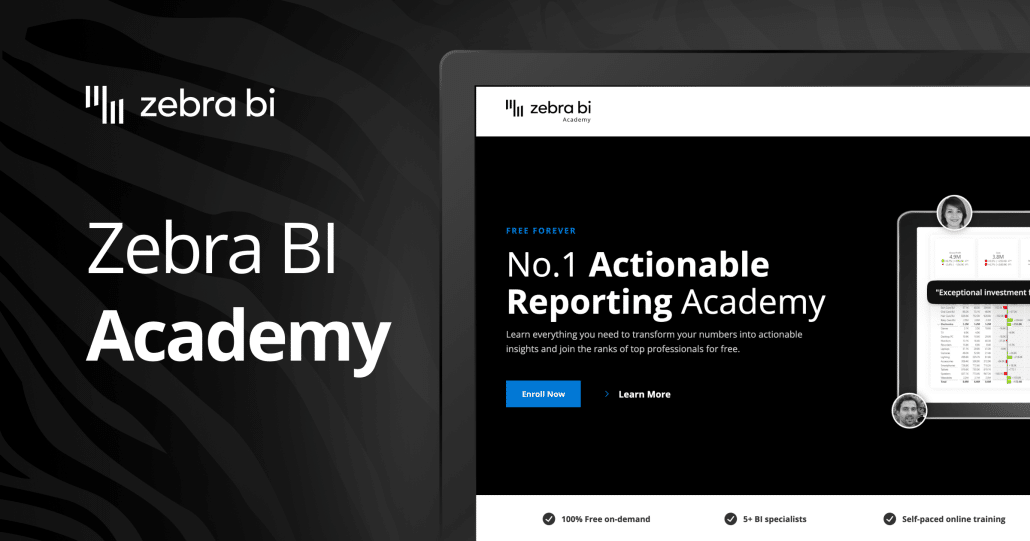
Zebra BI Academy: A Hub for Learning
Education is at the heart of empowerment. With the launch of Zebra BI Academy, we've opened doors to top-quality educational content accessible to everyone. Whether you're a seasoned professional or new to the world of BI, the Academy offers a wealth of resources to keep you ahead in the reporting game.
Our academy includes structured video tutorials, comprehensive learning materials, and interactive quizzes to guide your learning journey – all for free. This structured approach ensures you gain a deep and practical understanding of BI, regardless of your experience level. It's a complete package designed to keep you at the forefront of the reporting game, empowering you with knowledge and skills in an engaging and effective way.
Collaboration with Leila Gharani: Expanding Educational Horizons Even Further
Our collaboration with Leila Gharani has been a significant step in expanding our educational outreach. Together, we created an insightful tutorial on crafting the most effective Excel dashboard from scratch. This collaboration combines Leila's Excel expertise and our innovative Zebra BI tools, providing a complete guide for professionals at all levels. The tutorial emphasizes the importance of interactive Excel dashboards in today's data-driven world, offering practical steps and tips for creating effective, professional dashboards that present data clearly and impactfully.
This partnership is part of our commitment to improving data presentation skills using Excel and Zebra BI tools. For more details, check out the full article here.
Power BI Updates: Elevating Your Data Experience
In 2023, our Power BI updates enhanced data visualization capabilities. The updates introduced features like new small multiples in Zebra BI Charts, providing more flexibility and clarity in visual representation. We improved the user experience with more intuitive interactions and clearer displays. Additionally, the Cards visual was enhanced with advanced KPI sorting and highlighting capabilities, enabling more dynamic and insightful data presentations.
For detailed insights into these transformative updates, visit the respective pages for Zebra BI Tables 6.6, Power BI UX Improvements, and Cards 1.6 Update.
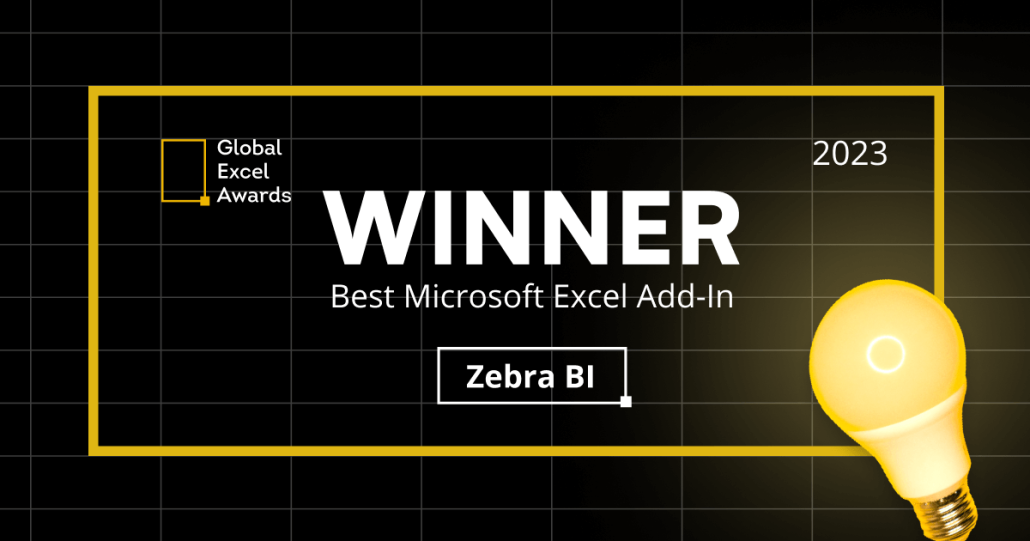
Global Excel Summit Award: A Testament to Excellence
We're thrilled to share that our dedication to enhancing your Excel experience with Zebra BI has been recognized globally. Winning the "Best Microsoft Excel Add-In" at the Global Excel Awards is our success and a reflection of how we empower you, our users, to transform data into impactful stories. This award celebrates your trust in us and the innovative ways you use Zebra BI to make data-driven decisions.
Together, we're shaping a more insightful world, one report at a time. For more about this achievement, read our blog post here.
We'll be there in 2024, too! So, reserve your tickets in time:
Educational Insights on Our YouTube Channel
This year, our BI team grew stronger, with Matija Prijatelj joining us as not just another BI Specialist but a YouTube star-in-making. His arrival has brought a new dynamic to our educational outreach on YouTube. With Matija's expertise, we've consistently delivered insightful and educational videos, enriching your learning experience in data visualization. These videos are a great resource for anyone looking to enhance their skills in BI tools like Power BI, Excel, and PowerPoint.
Don't miss our "12 Days of Report Makeover" campaign, where we tackle daily data visualization challenges. This series is a great way to see Zebra BI in action and gather insights for your own reporting needs.
Looking Ahead: The Dawn of Zebra AI
We're heading into 2024 with a game-changer: Zebra AI. This year, we launched our Zebra AI beta program, marking our move into more intelligent, actionable data analysis. It's all about giving your data an AI-powered boost, helping you uncover the actionable intelligence you need for smarter decisions. This isn't just a future concept—it's happening right now at Zebra BI, revolutionizing how we approach data analysis and reporting.
Community Connection: Your Voice Matters
Your feedback and reviews have been a huge part of our growth. We truly value your thoughts and are excited about continuing this collaborative journey. If Zebra BI Tables, Charts, or Cards have enhanced your reporting experience, we'd love to hear about it. Take a moment to write us a review – it means a lot to us!
You can also share your experiences on platforms like G2 or Capterra. And here's something more: email us after posting your review, and we'll thank you with a free Zebra BI T-shirt. Your support and insights help us improve and reach more data enthusiasts like you!
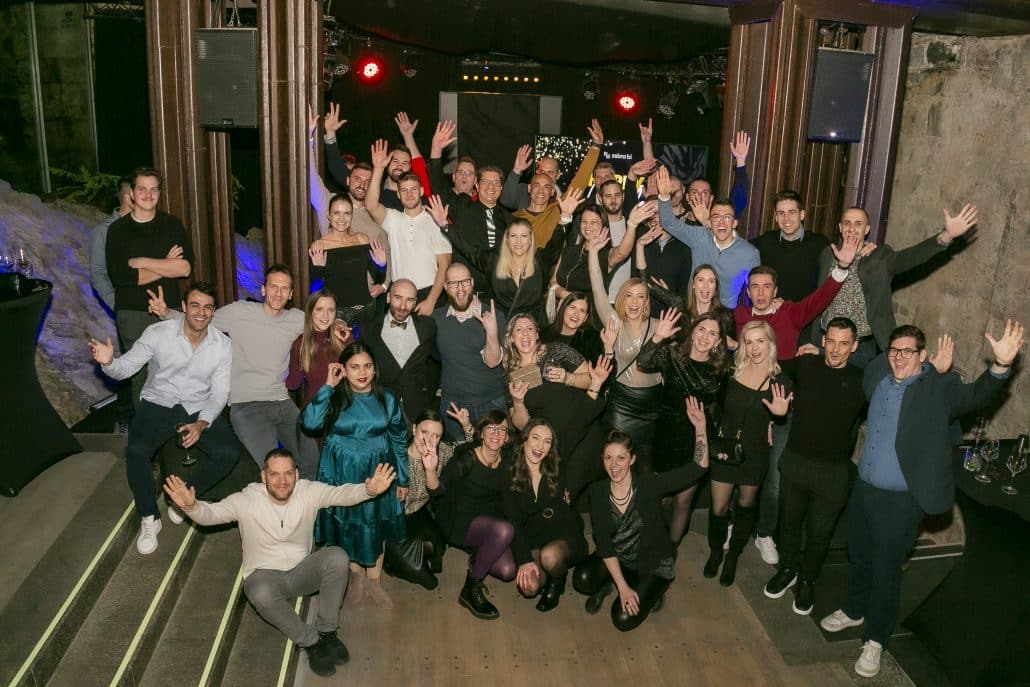
Gratitude and Wishes
As we close this year – and this blog post – we are filled with gratitude. Being recognized as one of the fastest-growing companies and receiving awards for our products only motivates us to reach greater heights. But the most valuable recognition comes from you, our users, and the community. Your support and trust fuel our passion and innovation.
So, as we step into the holiday season and gear up for an exciting 2024, we extend our warmest wishes to you and your loved ones.
Here's to another year of growth, learning, and exceptional data storytelling!
No more FOMO: Sign up for our newsletter
Don't miss out on any Zebra BI news. By signing up for our newsletter, you'll get quarterly updates, webinar invites, and product news straight to your inbox. Join a community of #dataviz enthusiasts and stay informed about everything happening in the Zebra BI world. We'll ensure you're always in the loop with the latest insights and developments.