Discover key tips for Excel dashboard creation with Leila Gharani's tutorial and enhance your skills using Zebra BI's advanced tools for optimal analysis.
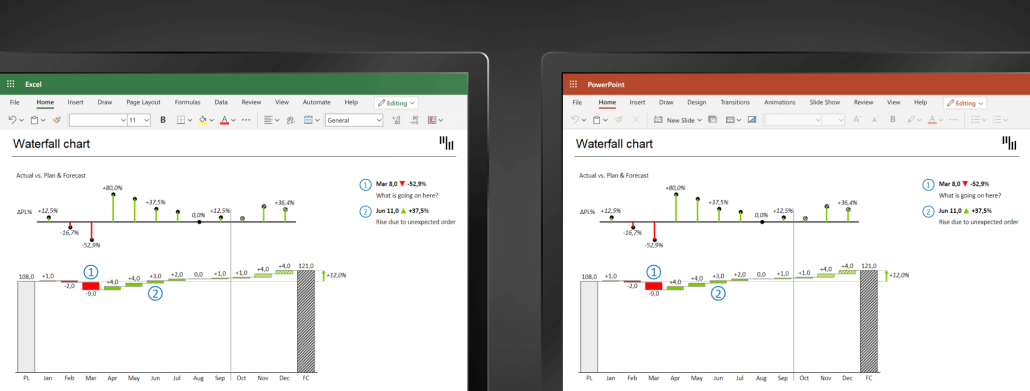
Reports in Excel & PowerPoint still don't follow the modern reporting best practices. What can you do about it? Start using the new Zebra BI for Office and join this live session to learn some tips & tricks.
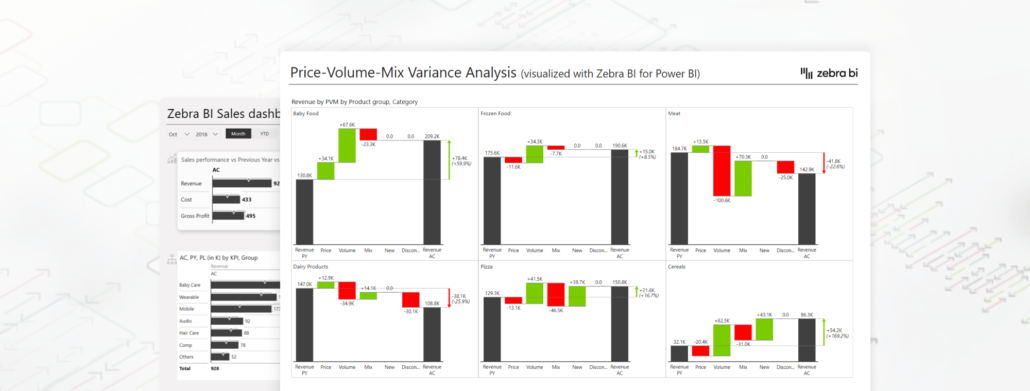
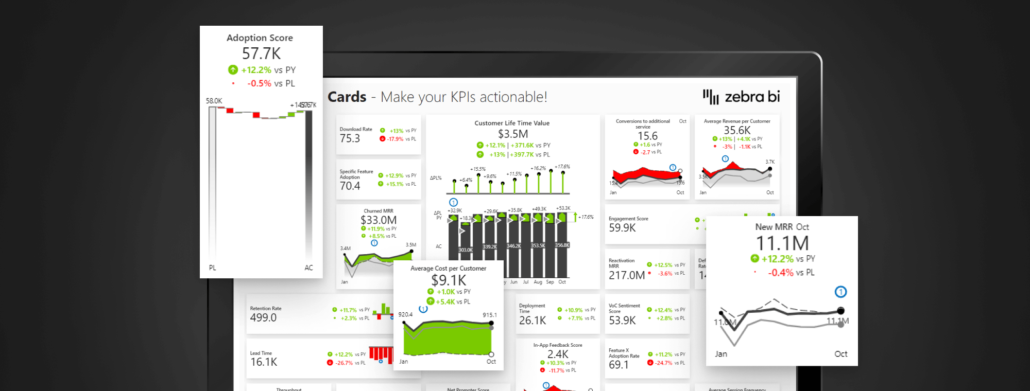
Start making decisions, based on data: from the concepts of Actionable Reporting to creating a winning landing page in Power BI. And grabbing attention where it matters.
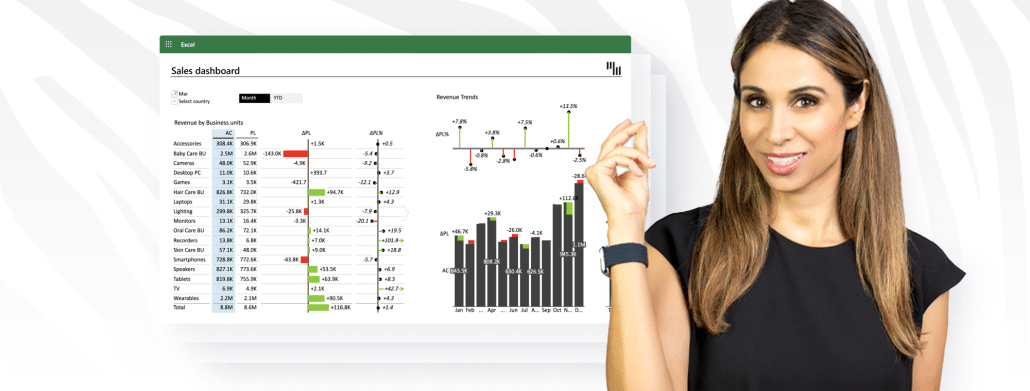
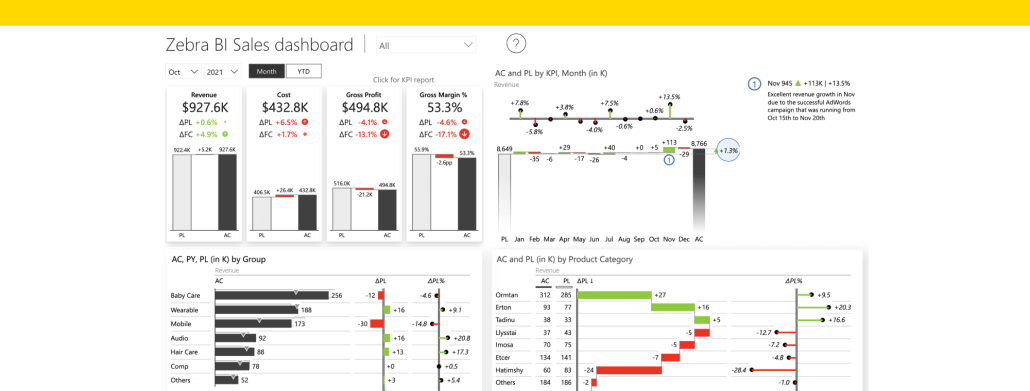
This Power BI template is designed to help you make an actionable Sales Dashboard. It includes all the essential elements and other Power BI dashboarding tips & tricks.
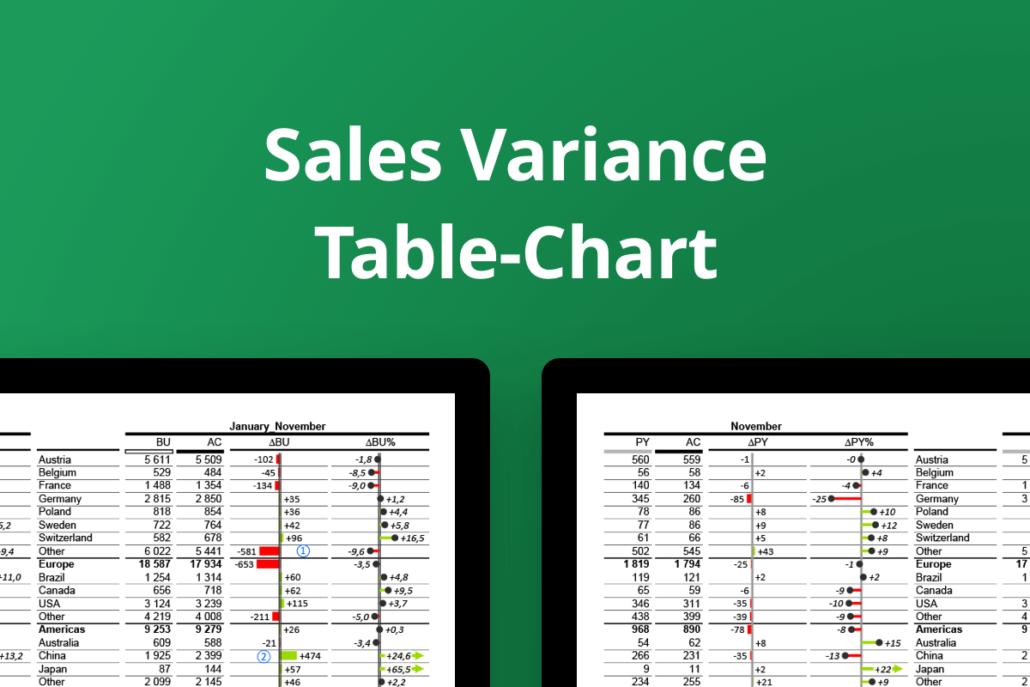
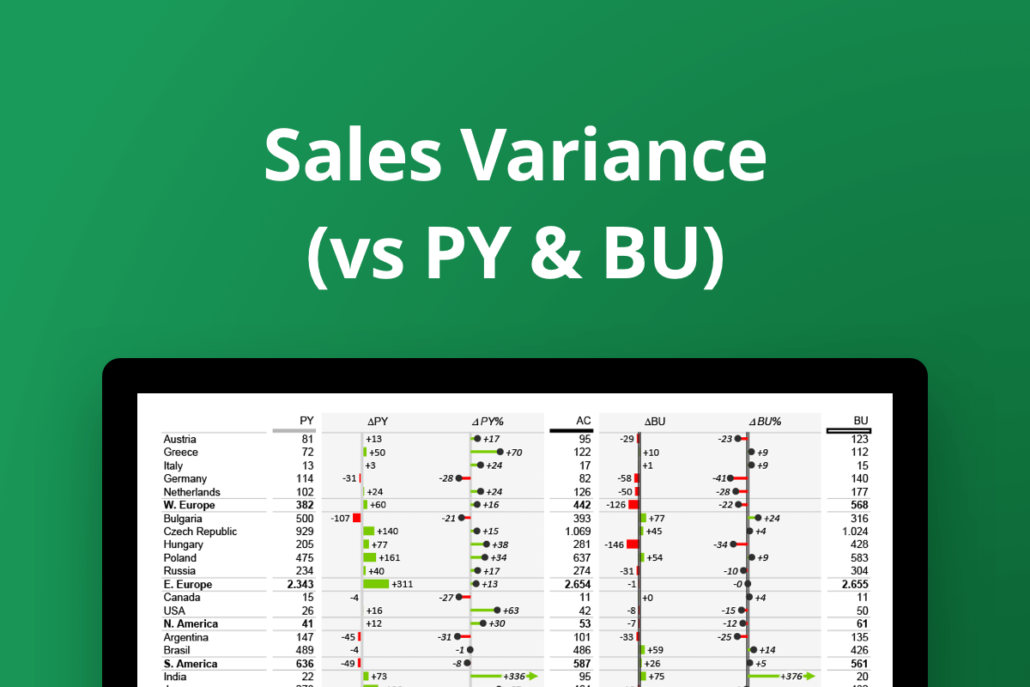
This Excel template displays AC, PY and BU data across countries. It's a combined table-chart report with absolute variances (vertical variance charts) and relative variances (vertical lollipop charts).
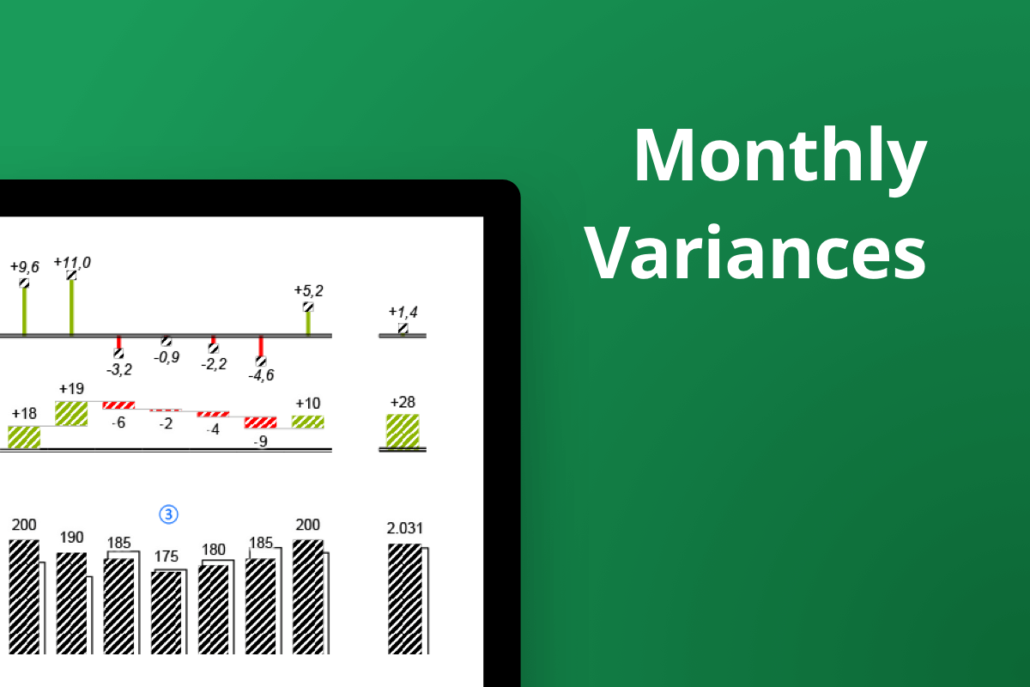
This Excel template visualizes monthly and year-to-date AC, FC and BU data featuring absolute and relative variances (using a waterfall and lollipop chart).
 September 8th
 February 22nd
 23 May 2024