How to Calculate Percent Change in Excel
Do you find yourself struggling to calculate percent change in Excel? If so, you're not alone. Percent change is a crucial metric for analyzing data trends, whether you're tracking stock prices, sales figures, or any other numerical data. Fortunately, Excel offers several formulas and functions to make percent change calculation easy and accurate. In this article, we'll take a detailed step-by-step look at how to calculate percent change in Excel.
Introduction to Percent Change Calculation in Excel
Before calculating percent change in Excel, let's review what percent change is and why it's useful. Percent change, also known as percentage change or relative change, is a measure of the difference between two values expressed as a percentage of the initial value. It's a standard metric used in financial analysis, scientific research, and other fields to track changes in data over time.
One of the key benefits of using percent change is that it allows us to compare data sets with different scales or units. For example, if we want to compare the growth rates of two companies, one with a revenue of $1 million and the other with a revenue of $100 million, we can use percent change to make a meaningful comparison. Additionally, percent change can help us identify trends and patterns in data that may not be immediately apparent when looking at raw numbers.
Understanding the Basic Formula for Calculating Percent Change
The basic formula for calculating percent change in Excel is straightforward:
Percent Change = (New Value - Old Value) / Old Value x 100%
This formula calculates the difference between the new and old values, divides it by the old value, and multiplies the result by 100 to convert it to a percentage. Let's look at how to apply this formula in Excel.
It's important to note that the percent change formula can calculate both increases and decreases in value. If the result of the formula is a positive number, it indicates an increase in value, while a negative number indicates a decrease in value. The percent change formula can also be applied to various data sets, including financial data, sales figures, and website traffic statistics. By understanding how to use this formula, you can gain valuable insights into trends and changes in your data over time.
Steps to Calculate Percent Change Using Excel's Formulas
To calculate percent change in Excel, follow these steps:
Step 1: Enter the old value in cell A1 and the new value in cell A2.
Step 2: In cell A3, enter the formula =((A2-A1)/A1)*100.
Step 3: Press Enter to calculate the percent change.
That's it! You now have the percent change between the old value in cell A1 and the new value in cell A2.
Additional Information:
It is important to note that the percent change formula can also be used to calculate the percentage increase or decrease between two values. If the result of the formula is a positive number, it indicates a percentage increase, while a negative number indicates a percentage decrease.
Effortless Variance Analysis with Zebra BI
With Zebra BI, there’s no need to enter formulas or deal with formatting to calculate variances manually. The software automatically calculates both absolute and relative variances for you. This enables a more streamlined and insightful variance analysis.
Here's a simple comparison to show the ease and added value of using Zebra BI:
Manual Calculation in Excel:
In a standard Excel table, you have columns for Previous Year (PY) and Actual (AC) figures.
You must create additional columns and formulas to calculate the variances and percentage changes.
Automated Variance Analysis in Zebra BI:
Zebra BI automatically calculates and displays the variances in a visually intuitive and IBCS-compliant format.
This way, not only is the percentage change automatically calculated, but you also immediately notice the key performance drivers and outliers, enabling more informed decision-making.
How to Calculate Percentage Change Over Time in Excel
There are two common ways to calculate percentage change over time - simple percentage difference and the Compound Annual Growth Rate (CAGR). Each serves different purposes based on the complexity of your analysis.
Simple Percentage Difference:
This method is straightforward and is well-suited for comparing two data points. The formula is as previously described in the guide.
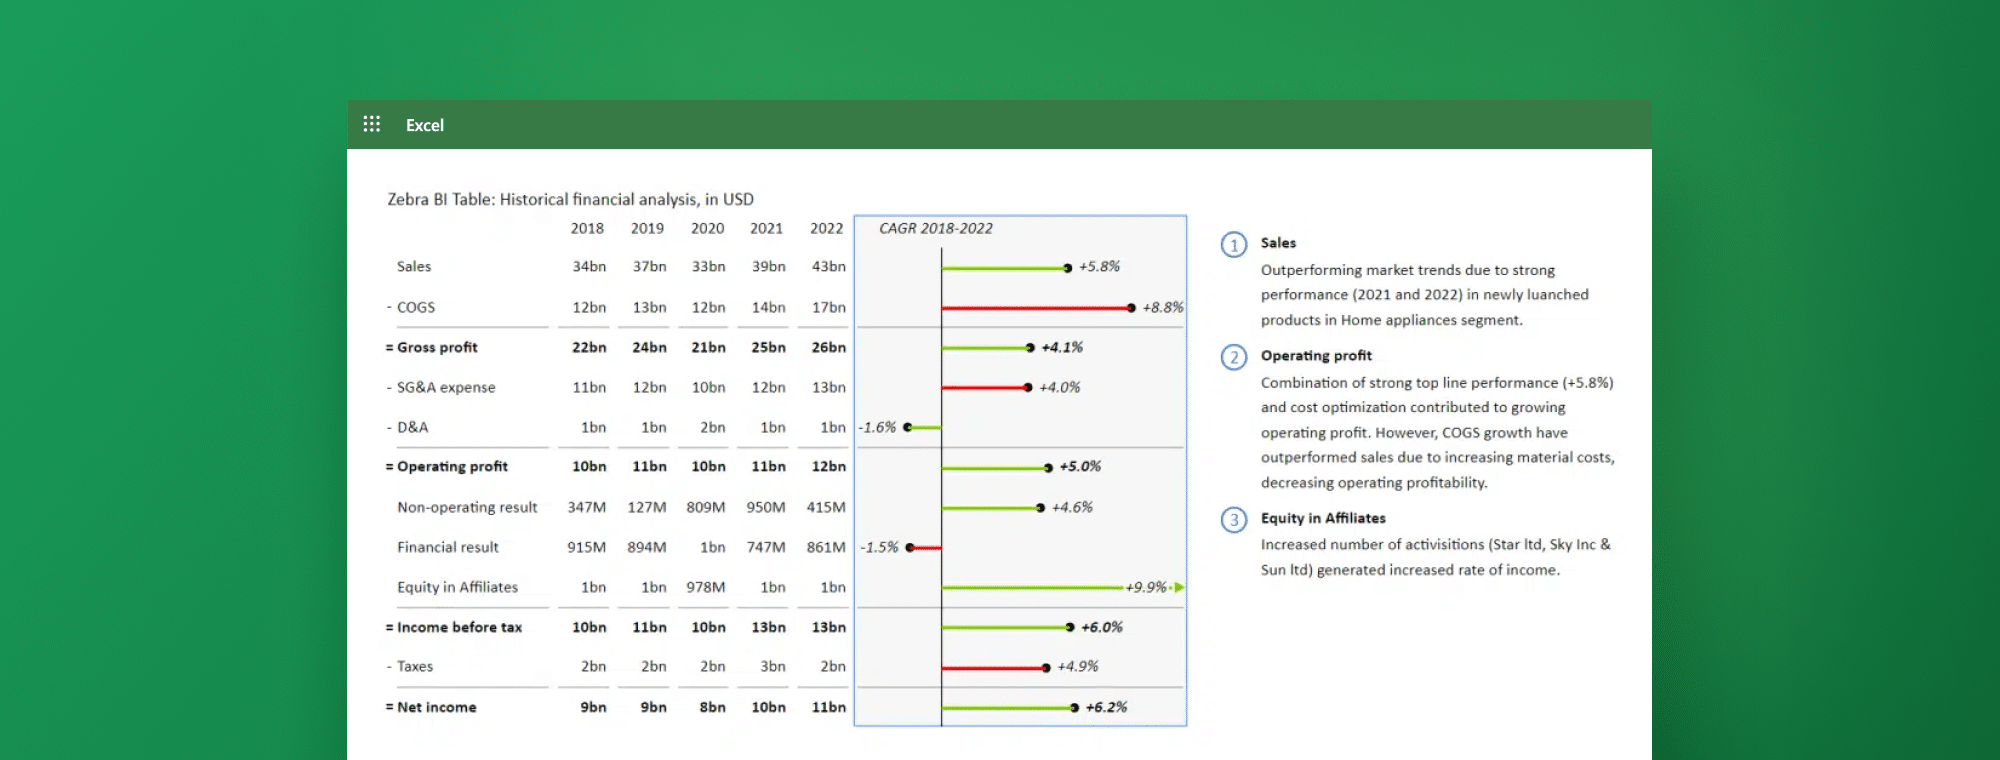
Compound Annual Growth Rate (CAGR):
CAGR provides a smoothed average growth rate over a series of periods, making it useful for understanding the geometric progression of data. The formula for CAGR is:
CAGR = (Ending Value/Beginning Value)^(1/Number of Years) - 1
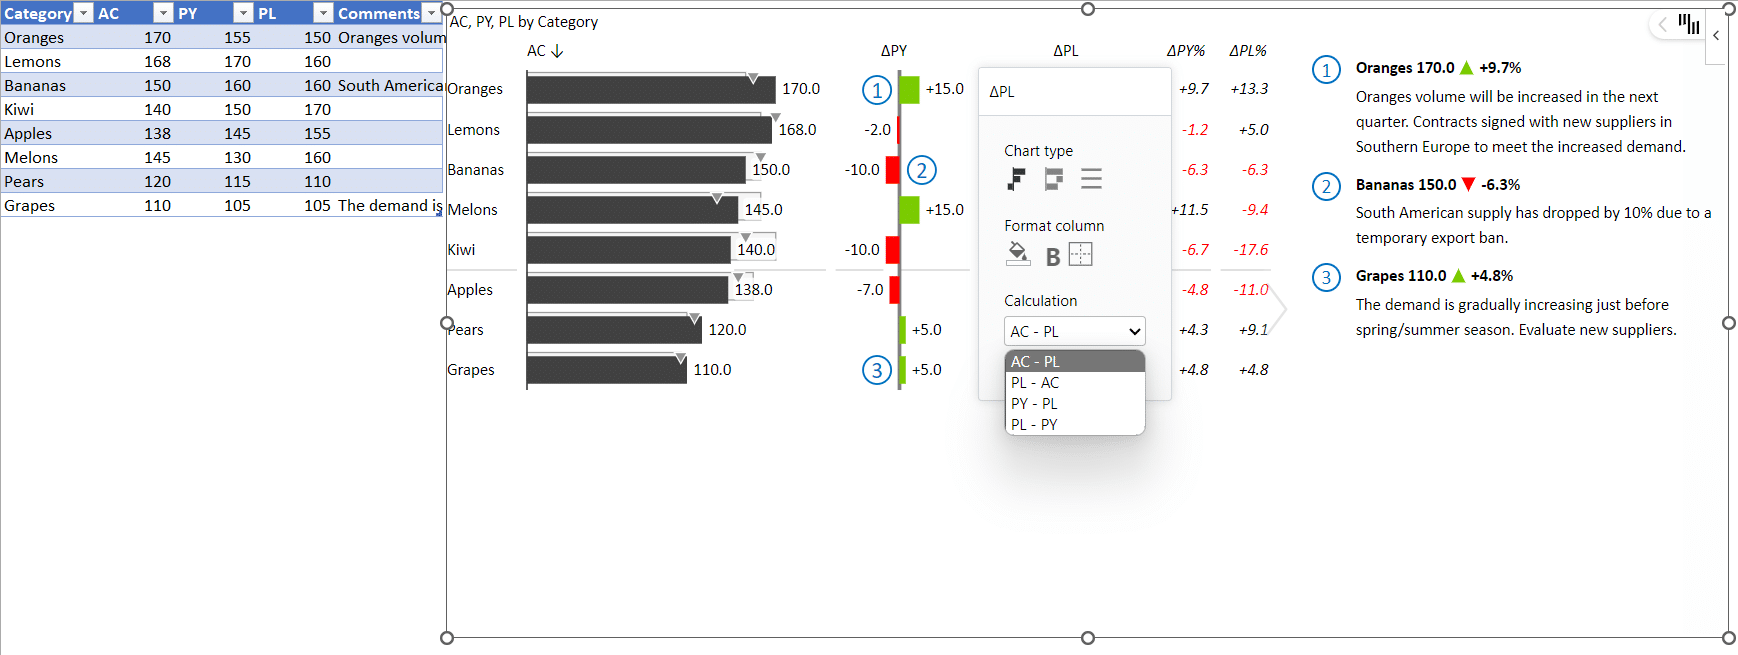
Zebra BI Tables support adding custom measures, allowing you to depict various dimensions and metrics simultaneously. This feature provides a comprehensive view and analysis of the data, making it easier to discern trends and make informed decisions.
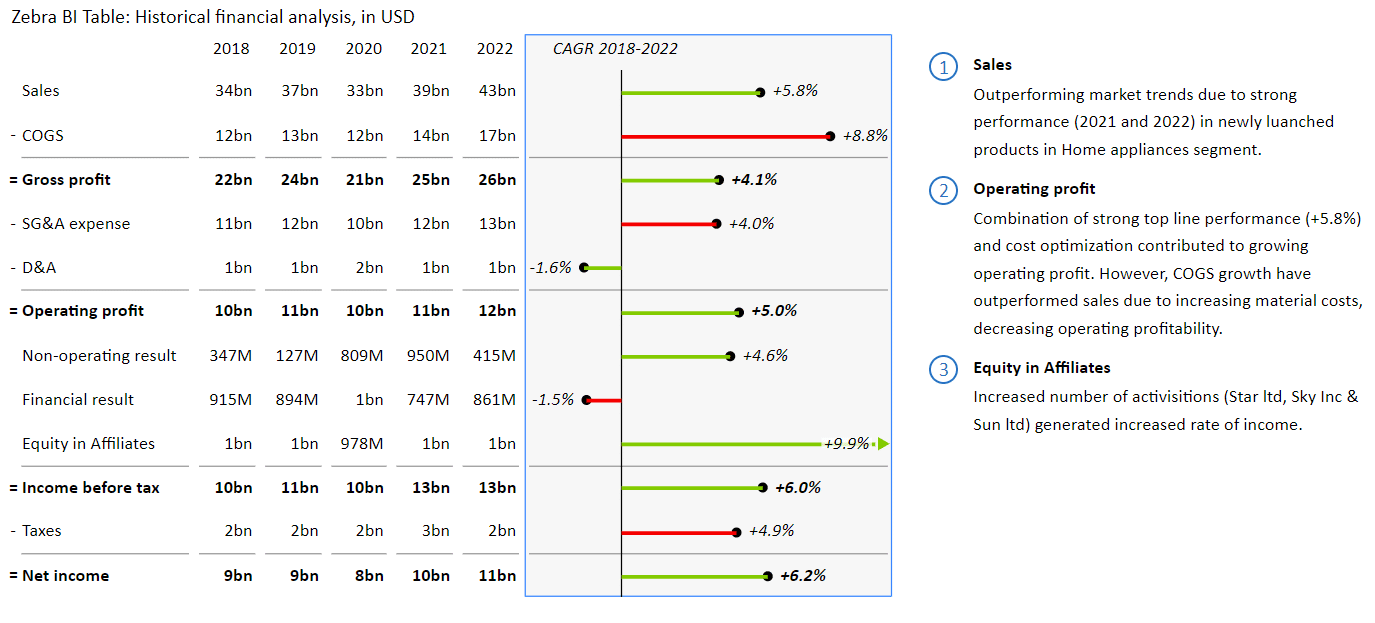
With Zebra BI, you can automate the calculation of percentage changes over time and easily visualize and analyze different dimensions of your data in one unified table, as shown in the image above.
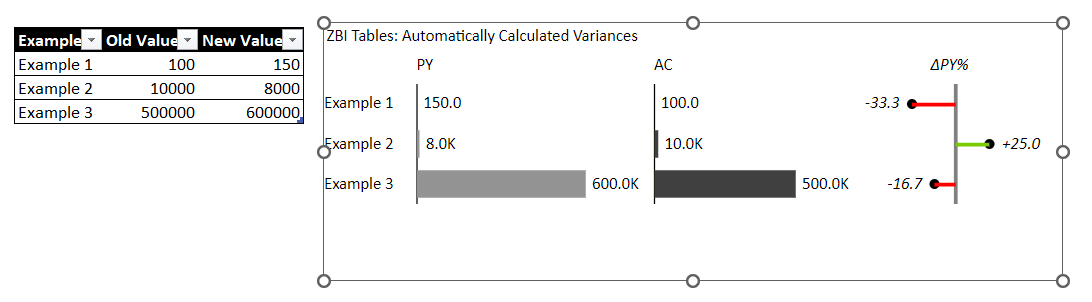
Calculating Percent Increase and Decrease in Excel: Examples and Tips
Let's look at some practical examples of calculating percent change in Excel.
Example 1: You bought a stock for $100, now worth $150. What is the percent increase?
To calculate the percent increase:
Step 1: Enter 100 in cell A1 and 150 in cell A2.
Step 2: In cell A3, enter the formula =((A2-A1)/A1)*100
Step 3: The percent increase is 50%.
Example 2: You had 10,000 website visitors last month and 8,000 visitors this month. What is the percent decrease?
To calculate the percent decrease:
Step 1: Enter 10000 in cell A1 and 8000 in cell A2.
Step 2: In cell A3, enter the formula =((A2-A1)/A1)*100.
Step 3: The percent decrease is 20%.
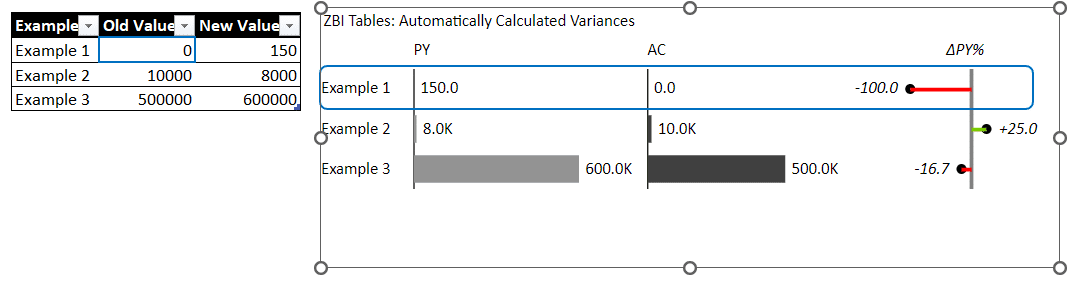
Example 3: Your company's revenue was $500,000 last year, and this year it is $600,000. What is the percent increase?
To calculate the percent increase:
Step 1: Enter 500000 in cell A1 and 600000 in cell A2.
Step 2: In cell A3, enter the formula =((A2-A1)/A1)*100.
Step 3: The percent increase is 20%.
Calculating percent increases and decreases is useful for analyzing data and making informed decisions. You can easily calculate these percentages using Excel and gain valuable insights into your business or personal finances.
All 3 examples can be shown in one table when using Zebra BI Tables, and the variance is automatically calculated.
Analyzing Data Trends with Percent Change Calculation in Excel
Percent change is a powerful tool for analyzing data trends over time, whether you're tracking sales figures, website traffic, or any other numerical data. By regularly calculating percent change, you can identify patterns and trends in your data that can inform your business decisions.
One of the benefits of using percent change calculation in Excel is that it allows you to compare data sets of different sizes. For example, if you're comparing the growth of two different companies, one with a larger starting revenue and one with a smaller starting revenue, percent change can help you see which company is growing at a faster rate, regardless of its initial size.
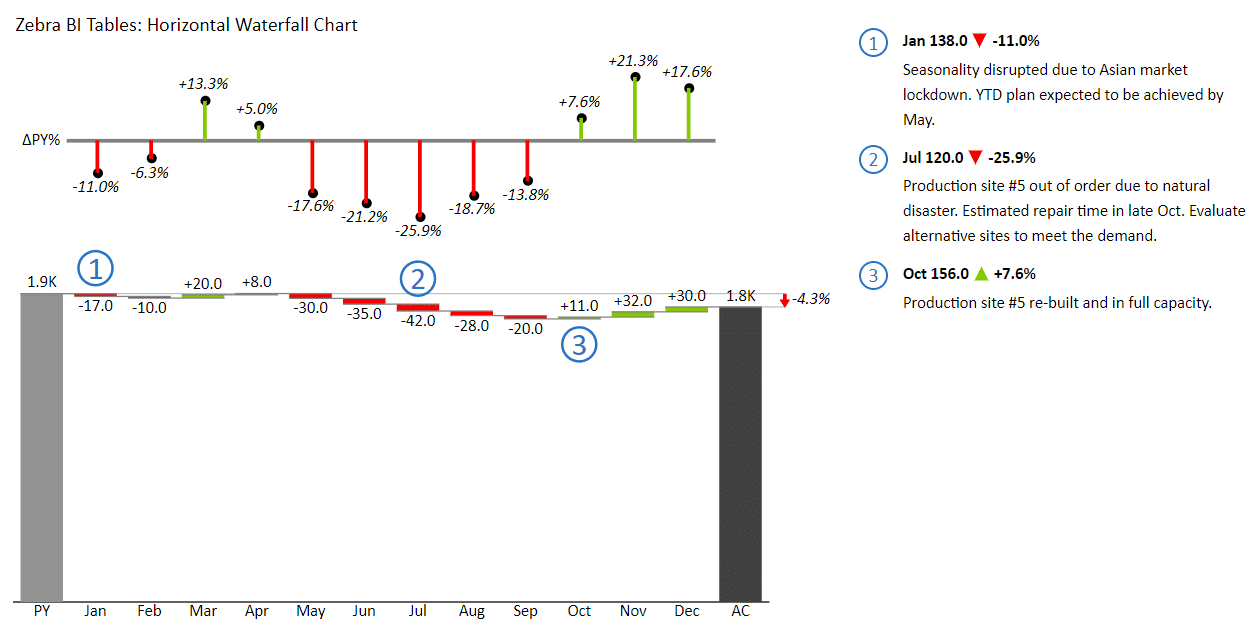
Another advantage of using percent change is that it can help you identify outliers or anomalies in your data. If you see a sudden spike or drop in percent change, it may indicate a problem or opportunity that requires further investigation. By drilling down into the data behind the percent change, you can understand what's driving the trend and take action accordingly.
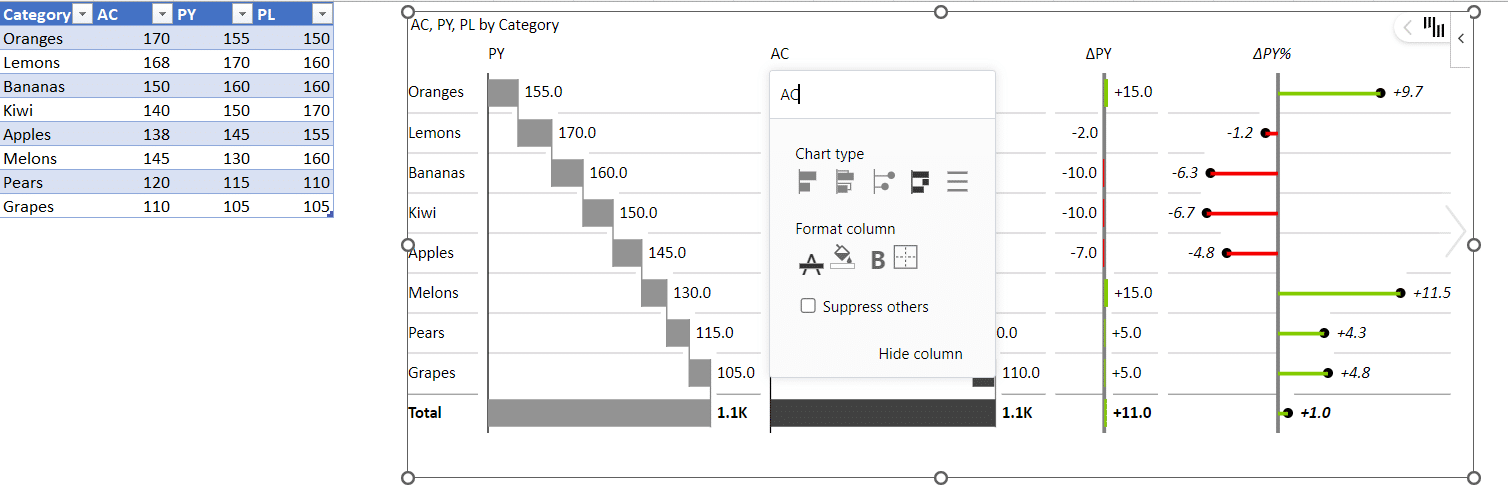
With Zebra BI Charts, relative variances/percentage changes are automatically calculated for each month, and there are also difference highlights. Again, it takes no effort from you other than adding an add-in. Zebra BI Chart does the rest.
Troubleshooting Common Errors When Calculating Percent Change in Excel
When calculating percent change, especially over large datasets, errors can arise. However, with Zebra BI, many common errors encountered in Excel are effortlessly handled or avoided:
Dividing by Zero:
In traditional Excel calculations, a division by zero would result in a #DIV/0 error. However, Zebra BI Tables handle such scenarios gracefully without displaying any errors.
Entering the Formula Incorrectly:
In Excel, small typos can cause significant calculation errors. It's crucial to double-check your formulas for accuracy.
There's no need to worry about typos or incorrect formula entries with Zebra BI Tables and Charts. The calculations are automated, minimizing the risk of human error.
Using the Wrong Values:
Zebra BI ensures accurate calculations by using the correct values. Moreover, it allows customization of variance calculations should you have specific analytical requirements. By default, Zebra BI Tables and Charts calculate variances as described throughout this guide, ensuring consistency and accuracy.
Zebra BI simplifies the process of calculating percent change and variances, reducing the likelihood of common errors that could occur when manually entering formulas in Excel. This ensures a more accurate and efficient analysis, allowing you to focus on deriving insights from your data.
Comparing Multiple Sets of Data Using Percent Change Calculation in Excel
When comparing multiple data sets, percent change can help you identify trends and patterns over time. Here's how to calculate the percent change between multiple sets of data:
Step 1: Enter the old values in column A and the corresponding new values in column B.
Step 2: Enter the formula =((B1-A1)/A1)*100 in column C.
Step 3: Autofill the formula down column C to calculate the percent change between all the data sets.
Advanced Techniques for Calculating Complex Percent Change Scenarios in Excel
Excel offers advanced techniques for calculating complex percent change scenarios, such as rolling averages and cumulative percent change. These techniques require more advanced formulas and functions and are best used with large data sets.
Best Practices for Presenting Percent Change Data in Visual Formats
When presenting percent change data, choosing the right visual format is important to make your data clear and understandable. Line charts, bar charts, and scatter plots effectively visualize percent change data over time.
Zebra BI offers robust solutions that enhance clarity and comprehension when presenting percent change data. Below are the Zebra BI tools that can significantly improve how you visualize and present percent change data:
Zebra BI Tables Benefits:
- Automatic Variances: Zebra BI Tables automatically calculate and display variances, saving time and reducing error.
- Integrated Charts: Features integrated charts like bar charts, overlapped charts, waterfall charts, and pin charts, which add a visual layer to data interpretation.
- Ease of Use: Intuitive design makes it easy to utilize, even for beginners.
- Comments with Comment Markers: Allows for annotated insights directly within the table.
- IBCS Compliant: Adheres to International Business Communication Standards (IBCS) for clear and consistent reporting.
- Ideal for Categorical Data Analysis: Especially useful when analyzing datasets with categories.
Zebra BI Charts Benefits:
- Automatic Variances: Like Zebra BI Tables, Zebra BI Charts also auto-calculate variances, simplifying the analysis.
- Ease of Use: A User-friendly interface promotes easy creation and manipulation of charts.
- Comments with Comment Markers: Enables annotated insights within the chart for better communication.
- IBCS Compliant: Ensures clear, consistent, and meaningful reporting.
- Variety of Chart Types: Offers waterfall charts and bridges with just a few clicks.
- Ideal for Trend Analysis: Especially effective when analyzing trends over time.
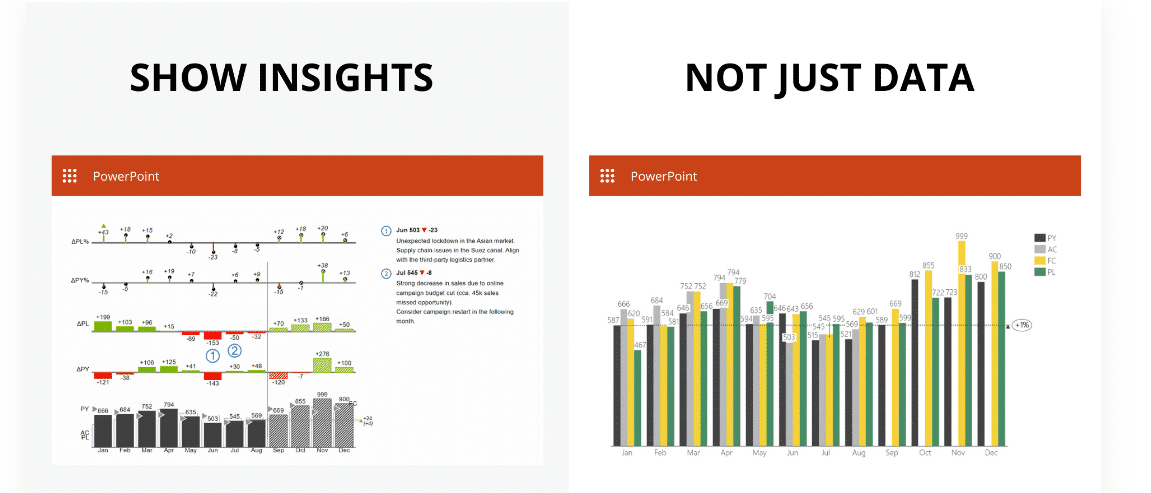
Zebra BI Charts offer a more straightforward and insightful visualization of data trends, with the added benefit of automatic variance calculations, something a normal clustered column chart doesn’t provide.
With Zebra BI, data visualization is enhanced, and the automatic calculation of variances and adherence to IBCS make data presentation clearer and more insightful, aiding better decision-making.
Tips to Speed Up Your Percent Change Calculation Process in Excel
To speed up your percent change calculation process in Excel, try these tips:
- Use Named Ranges: Instead of selecting cells manually, use Excel's named range feature to reference cells quickly and accurately.
- Create Templates: If you frequently calculate percent change for similar data sets, create a template you can use as a starting point.
- Use Macros: Macros can automate repetitive tasks, such as formatting or copying and pasting data.
The best trick is to use Zebra BI Tables and Charts, it doesn't get faster and easier than that. Try it for free!
How to Use Macros and Templates for Efficient Percent Change Analysis in Excel
To use macros and templates for efficient percent change analysis in Excel, follow these steps:
Step 1: Create a template with the formulas and formatting for your percent change calculations.
Step 2: Record a macro to automate repetitive tasks like copying and pasting data or applying a specific formatting style.
Step 3: Save your macro and template for future use.
You can streamline your percent change analysis process using macros and templates and focus on deriving insights from your data.
Conclusion
Calculating percent change, referred to in Zebra BI as a relative variance, is fundamental for analyzing data trends over time. It's essential whether you're evaluating stock prices, website traffic, or any other numerical data, as it aids in identifying patterns and facilitating informed business decisions.
Utilizing Zebra BI visuals offers a significant advantage in calculating and presenting relative variance. Here's a recap of the benefits:
Automatic Calculations: Zebra BI Tables and Charts offer out-of-the-box automatic calculations of relative variance, eliminating the need for manual formula entries.
Ease of Use: With no requirement for entering formulas manually, Zebra BI makes the calculation of relative variance straightforward and user-friendly.
IBCS Compliant Formatting: Zebra BI adheres to International Business Communication Standards (IBCS), ensuring a clear, standardized presentation of percentage differences. This adherence promotes better understanding and consistency across your data visualizations.
Clear and Understandable Presentation: The visuals provided by Zebra BI ensure that your data is presented in a clear and easily understandable format, enhancing communication and decision-making.
With Zebra BI, not only is the calculation of relative variance simplified, but the presentation of data is also elevated to a professional standard, promoting better analysis and informed decision-making. Happy analyzing!