Level of knowledge: Intermediate

Intermediate
October 19, 2024
Cost Analysis and Reporting Excel Template
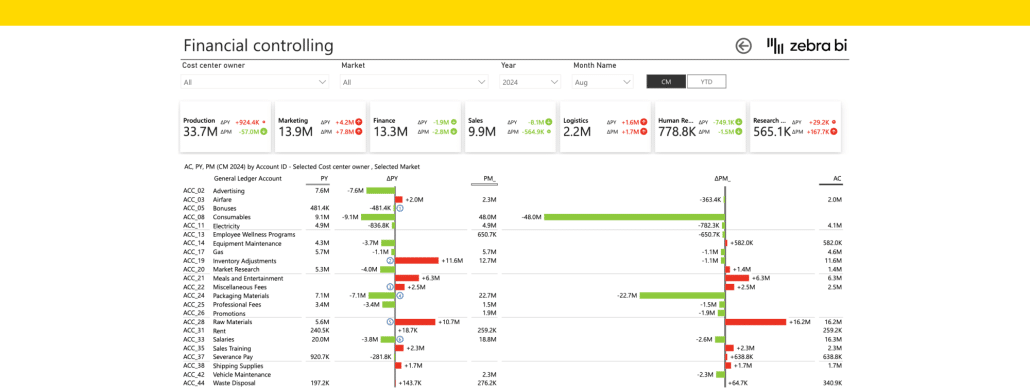
Track, analyze, and optimize your operational expenses with our comprehensive Cost Analysis Report template, designed to provide actionable insights and improve financial performance.
June 11, 2024
Mastering Brand and Product Portfolio in Power BI
Learn how to master the brand and product portfolio analysis in Power BI.
May 9, 2024
How to Create a Date Hierarchy in Power BI: Complete Guide 
Learn to organize and analyze time-based data in Power BI with the date hierarchy feature. This guide covers the benefits and provides a step-by-step process to create a date hierarchy, enhancing your data analysis from years to minutes.
May 24, 2023
Breaking it down: The Top 5 FP&A Tools for Excel in 2023 That You Can't Afford to Miss
Unlock the full power of Excel with the top 5 FP&A tools of 2023. Streamline analysis, modeling, reporting and visualization for data-driven success.
April 28, 2023
How to use Excel for financial statement analysis: 8 brilliantly simple tips
Master the art of financial analysis with our comprehensive guide. Learn how to use Excel for financial statement analysis and drive business success.
April 26, 2023
Best practices for using Excel for data visualization
The ultimate guide for using Excel for data visualization. Learn everything you need to create convincing and impactful reports and dashboards.
April 26, 2023
How to Use Excel for Market Analysis in 4 Simple Steps
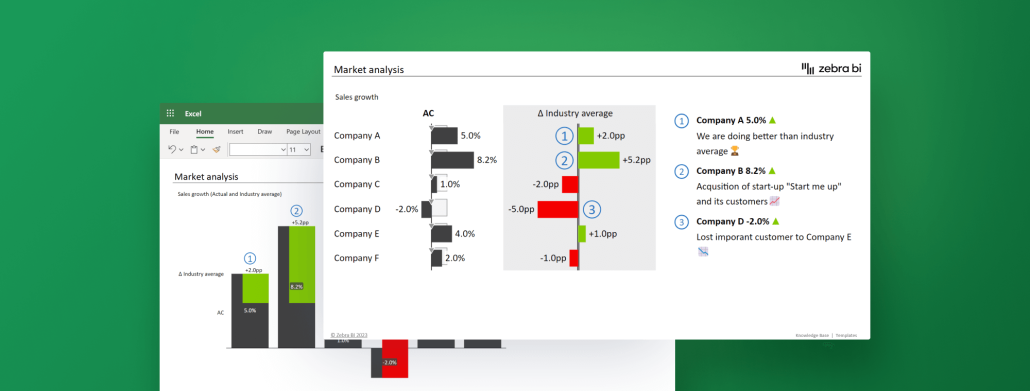
Learn to use Excel for market analysis with our step-by-step guide. Dive into your data, create effective visuals using Zebra BI for Office, and make data-driven decisions fast.
April 21, 2023
Best practices for creating Excel charts for financial reporting
Learn everything you need to create accurate, impactful & actionable financial reports using Excel charts. Based on best practices only!