Power BI for Business Analysts: Zebra BI Expert Session
In this expert session, we will present advanced Power BI reporting techniques for business analysts, who want to take their analytic dashboards and reports to the next level.
What's included
Full video recording
PBIX example used in the webinar
Enjoy & thank you for watching! Don't hesitate to reach out if you have any questions — write to us at support@zebrabi.com!
Presenter
Andrej Lapajne
Founder & CEO at Zebra BI
Watch the Video
Get PBIX Example
Download the PBIX example that we used at the webinar to check how it's done, copy the DAX code, or just find some inspiration. Hope it helps!
(0:00) - Introduction by Andrej Lapajne
(0:49) - What does a good dashboard need?
(4:34) - Business analyst's toolbox Best practice examples
(17:49) - Tables (creating a page with Zebra BI)
(32:40) - Group functionality
(35:20) - Controlling your visuals
(37:40) - Totals and subtotals
(47:54) - Changing views in tables
(49:22) - Zebra BI charts
(52:36) - Variance analysis (waterfall charts)
(59:44) - Adding additional field
(1:02:06) - Small multiples
(1:05:57) - Top/Bottom N + Others
(1:10:28) - Looking great on mobile
Ready to start uncovering actionable insights from your data?
Explore Zebra BI for Office and Power BI, or start a trial instantly and test our tools on your data. You can also contact us to help you build your first test report and create a custom package for your business.
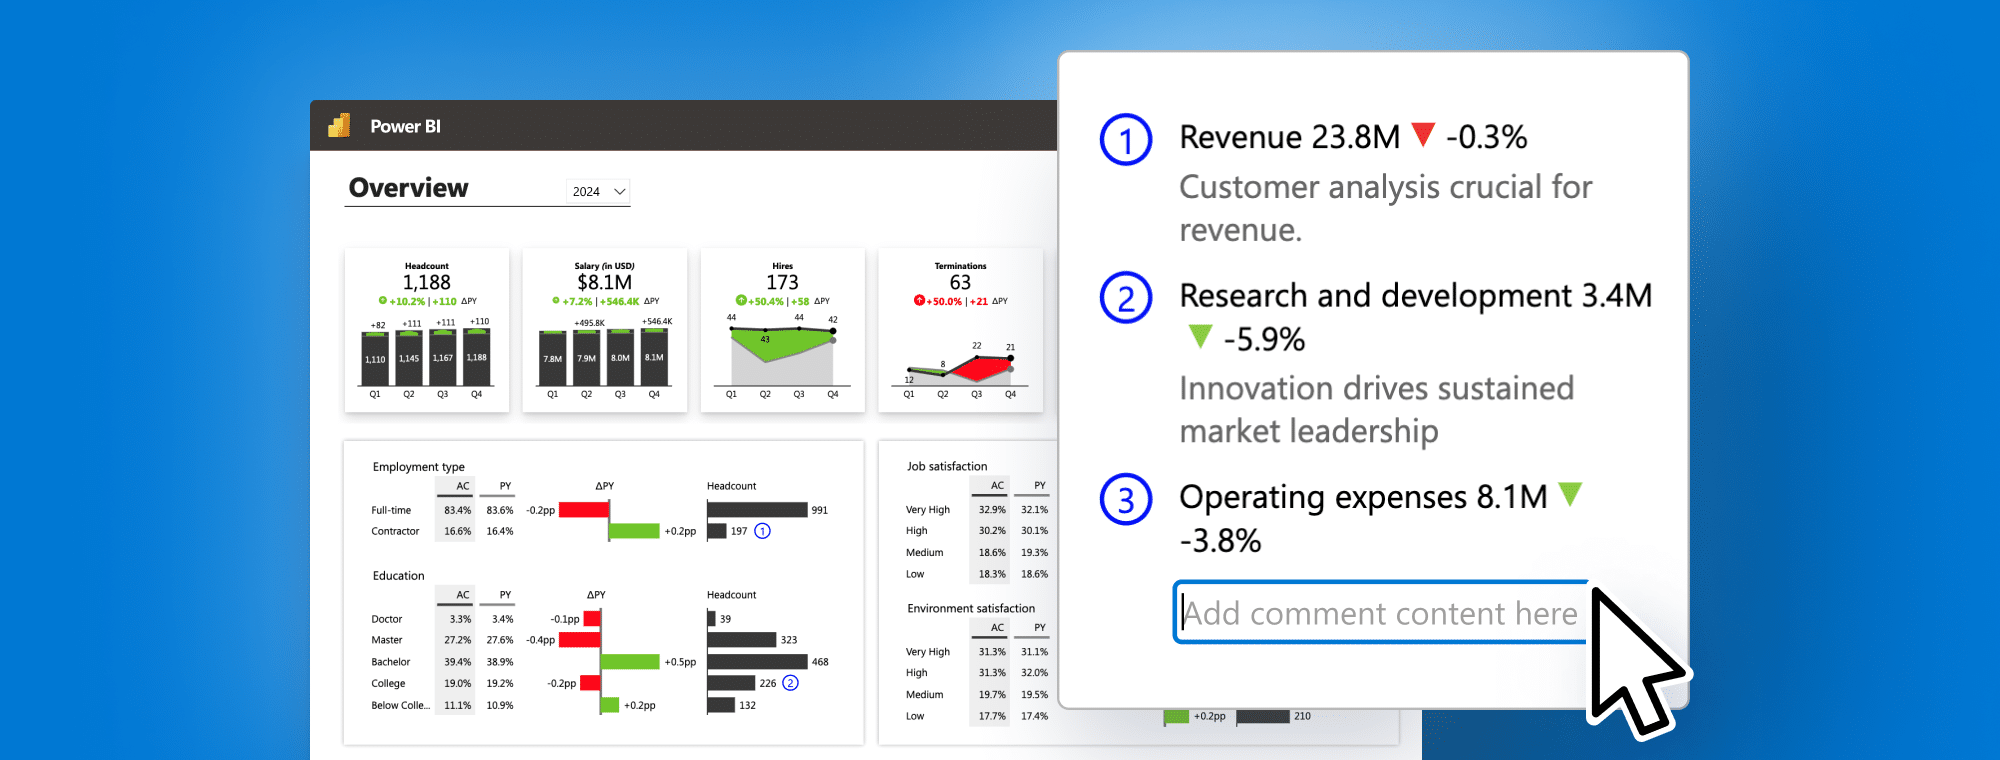
Join our webinar to explore the easiest way so far to do dynamic commentary in Power BI for clearer insights, quicker decisions, and smoother meetings.
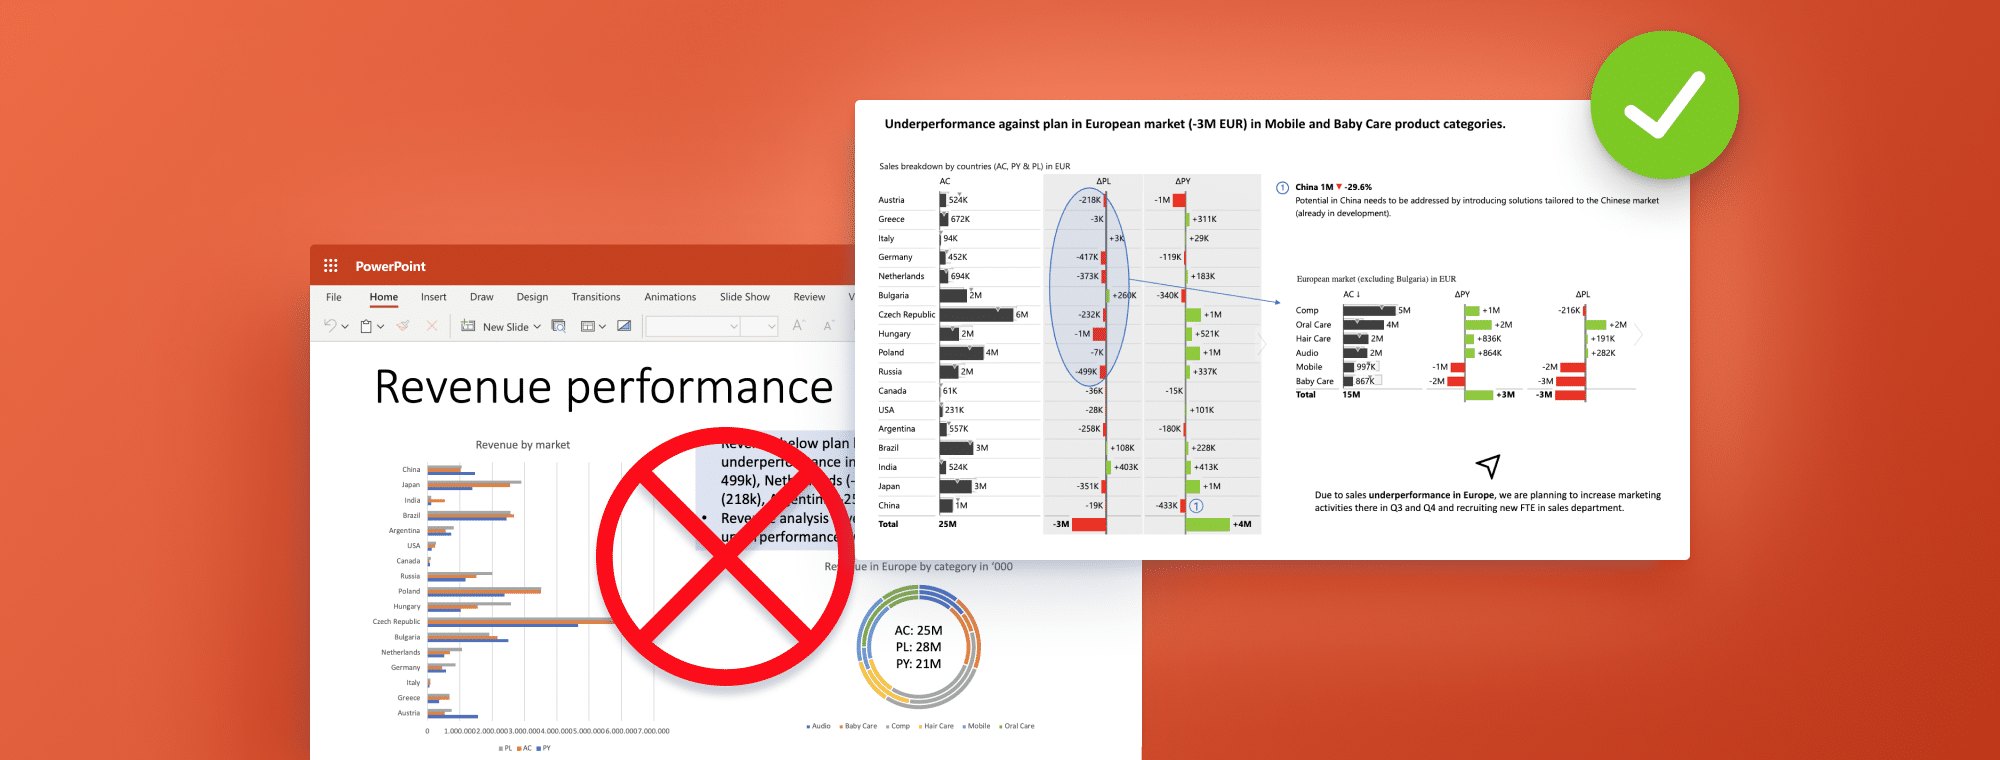
After gathering all the data you need it's time to present it effectively to your managers. And this doesn't mean using many different shapes and colors that tell nothing. Learn practical tips for a professional-looking and actionable PowerPoint slide deck.
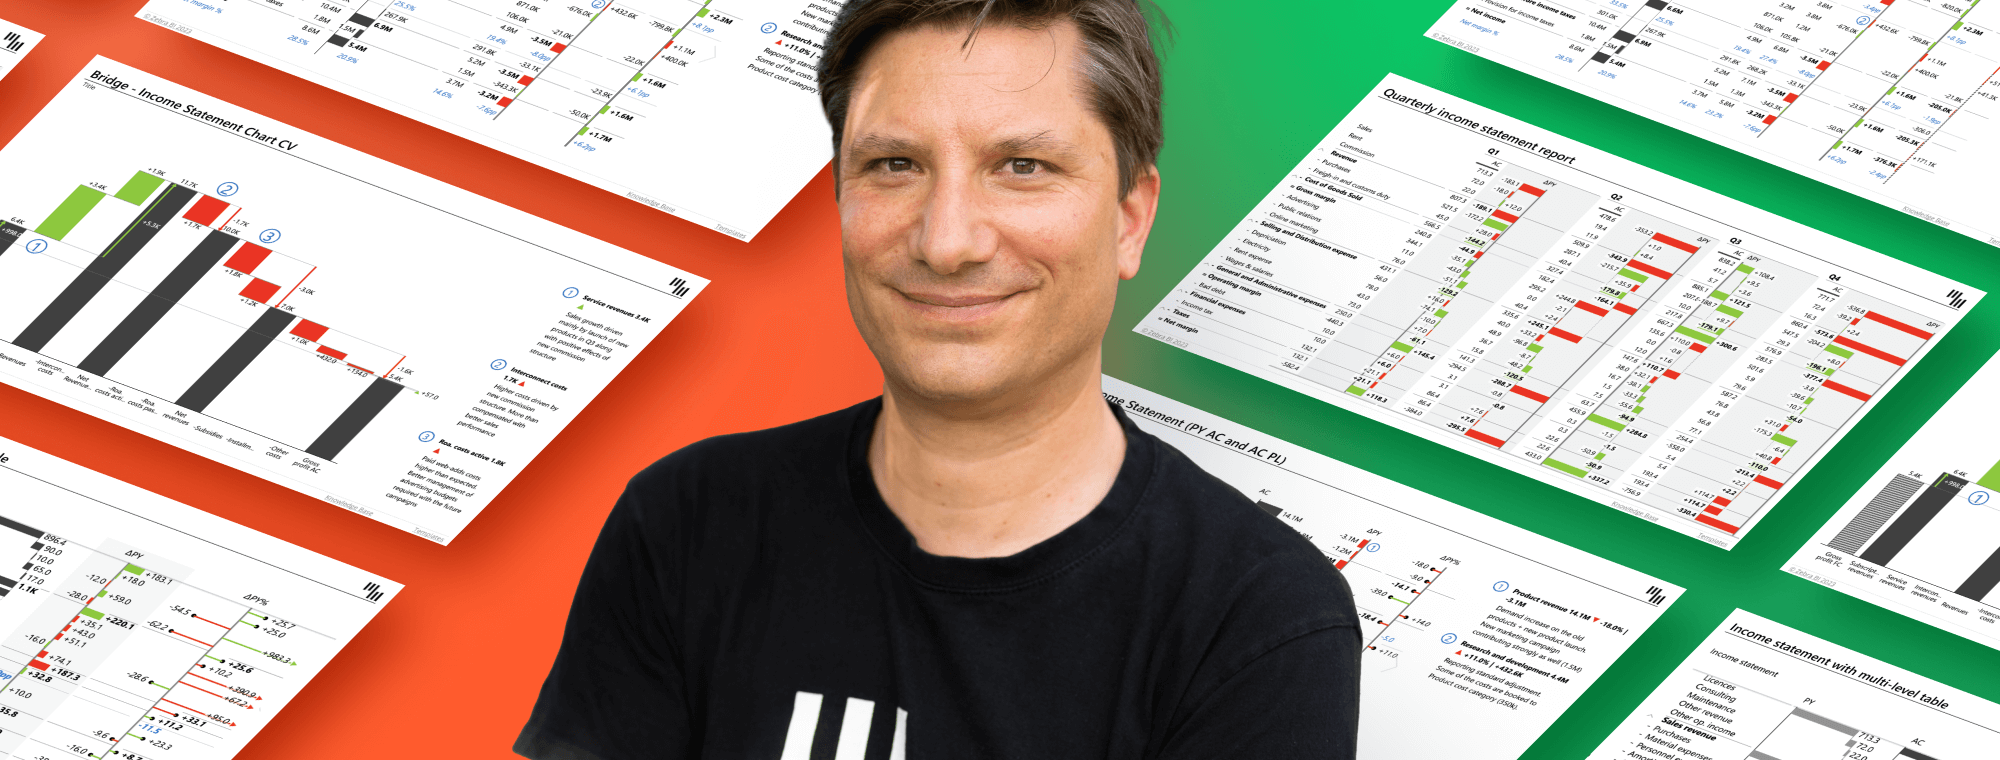
This webinar is all about financial analysis in Power BI. Take a look at the performance of some of the biggest Fortune 500 companies and use these practical examples to apply them to your data. Don't just create reports, generate insights.
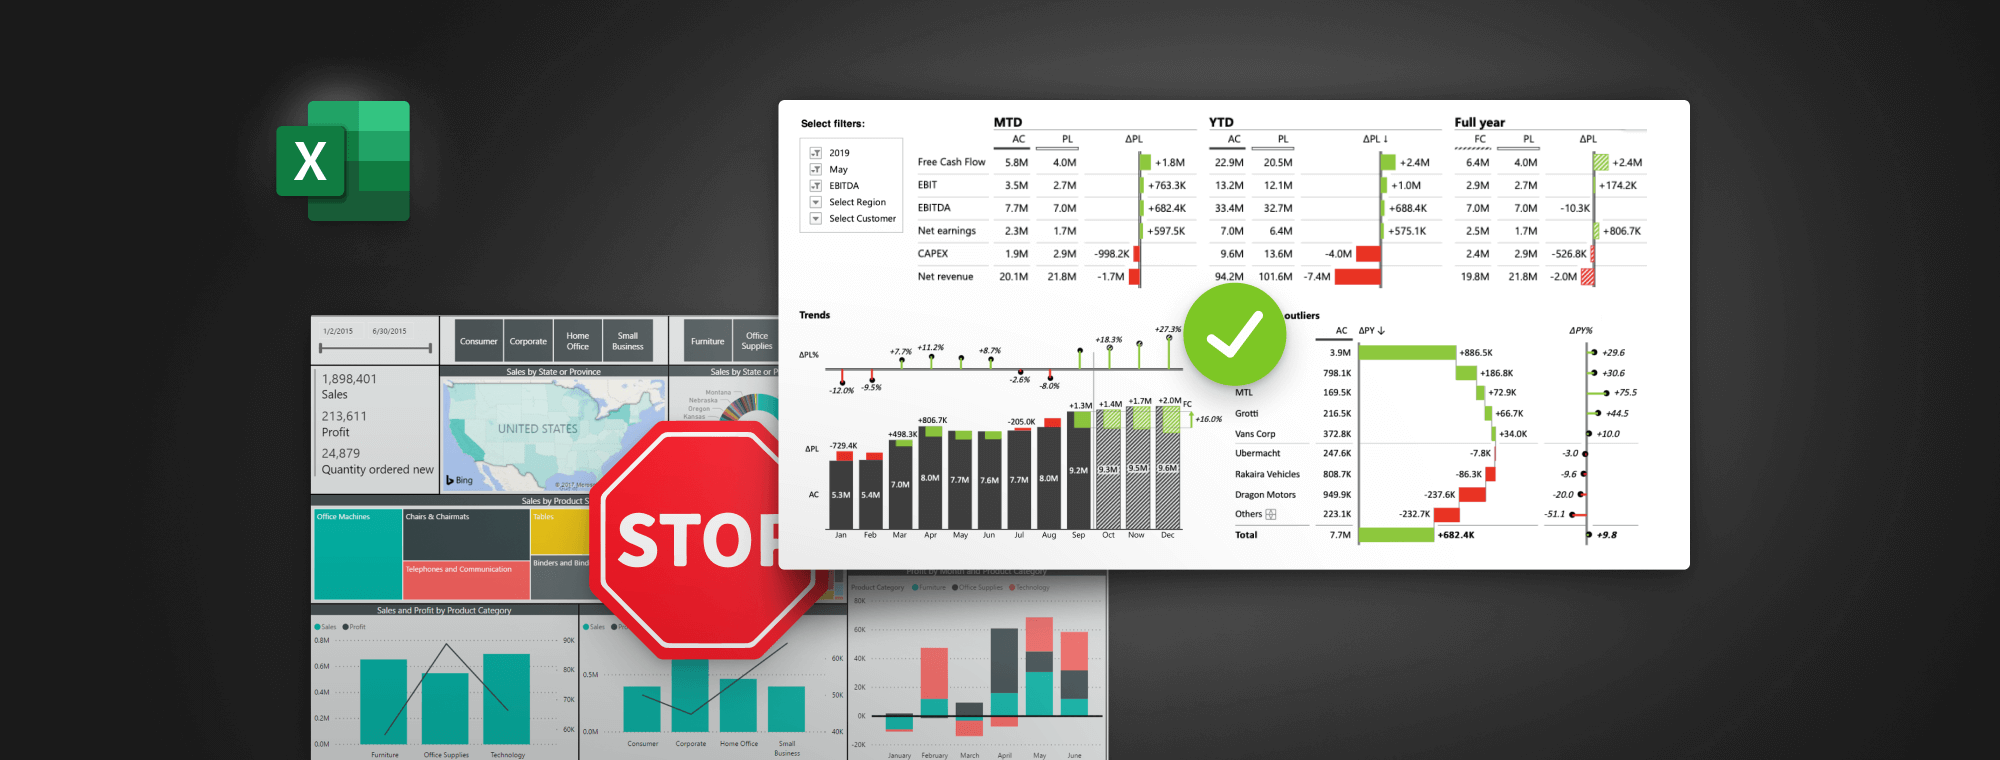
Learn how to create stunning, interactive Excel dashboards that provide immediate answers to your business questions and showcase your performance in a visually compelling way. Share your results easily and take your reporting to the next level, whether you're a seasoned BI pro or a passionate Excel enthusiast!
Learn how to create stunning, interactive Excel dashboards that provide immediate answers to your business questions and showcase your performance in a visually compelling way. Share your results easily and take your reporting to the next level, whether you're a seasoned BI pro or a passionate Excel enthusiast!
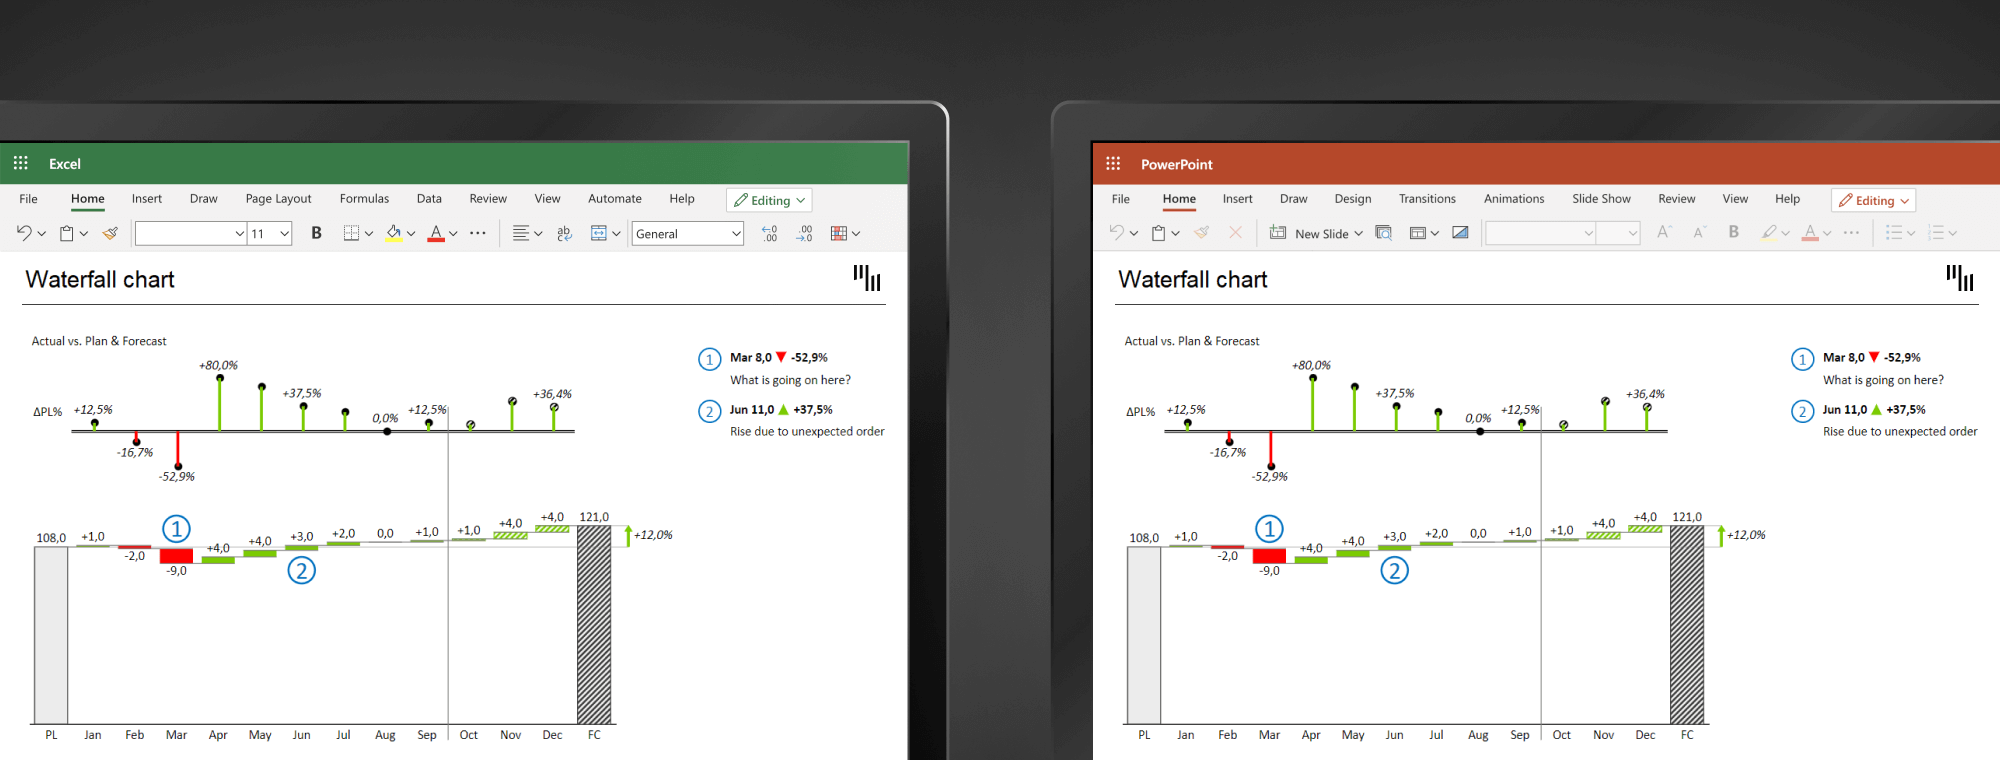
Reports in Excel & PowerPoint still don't follow the modern reporting best practices. What can you do about it? Start using the new Zebra BI for Office and join this live session to learn some tips & tricks.
 September 8th
 February 22nd