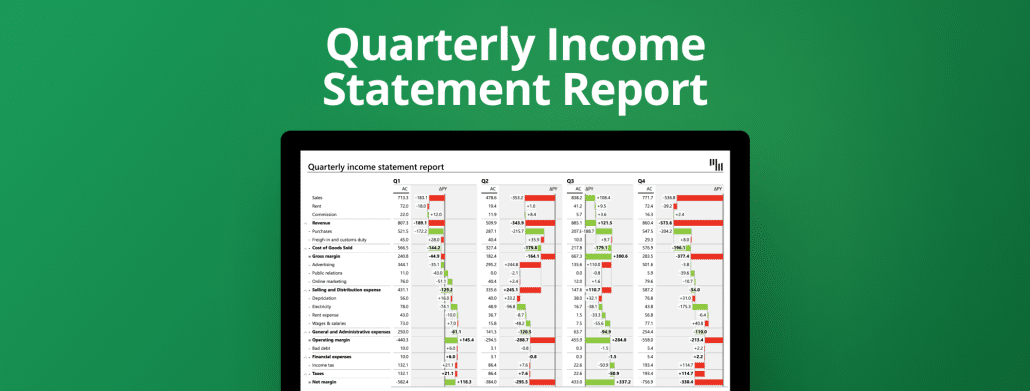
Use this template to visualize your P&L in Excel with quarterly data. The time dimension in columns lets you understand better the performance of your KPIs. By having the chance to hide unnecessary columns you can ensure an even better clarity of reports.
Use this template to visualize your P&L in Excel with multiple levels using expand & collapse functionality in a table with integrated charts. Get the right context with automatic variances & up to three comparisons.
If you take just a couple of minutes, you can rethink your approach to creating and designing your business reports. In this article, you can find key Excel report templates for some of the most commonly used business reports.
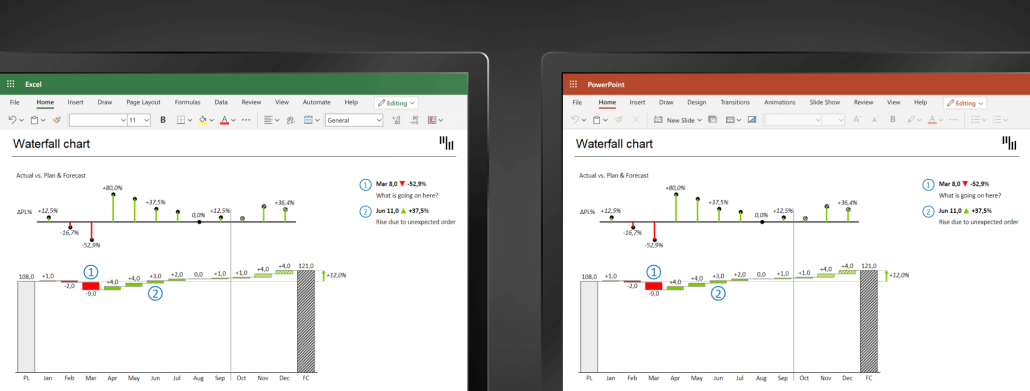
Reports in Excel & PowerPoint still don't follow the modern reporting best practices. What can you do about it? Start using the new Zebra BI for Office and join this live session to learn some tips & tricks.
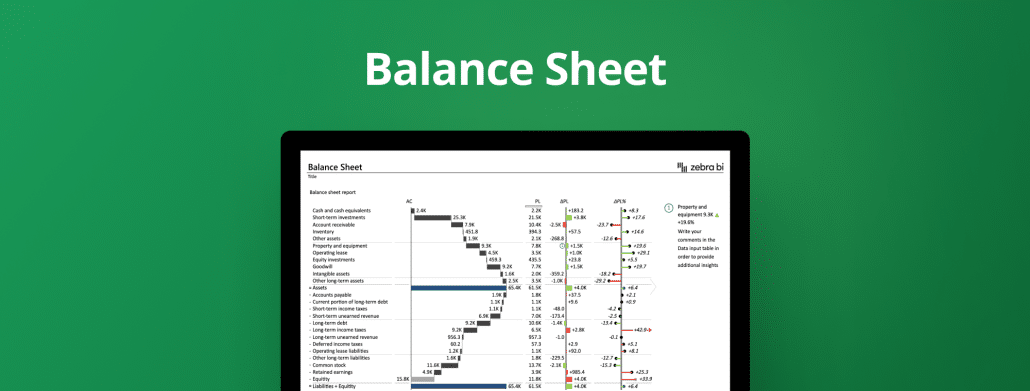
Visualize your company's financial position with table with integrated waterfall chart, custom calculations for invert & result, dynamic comments & automatic variances so that everybody know what is going on & why.
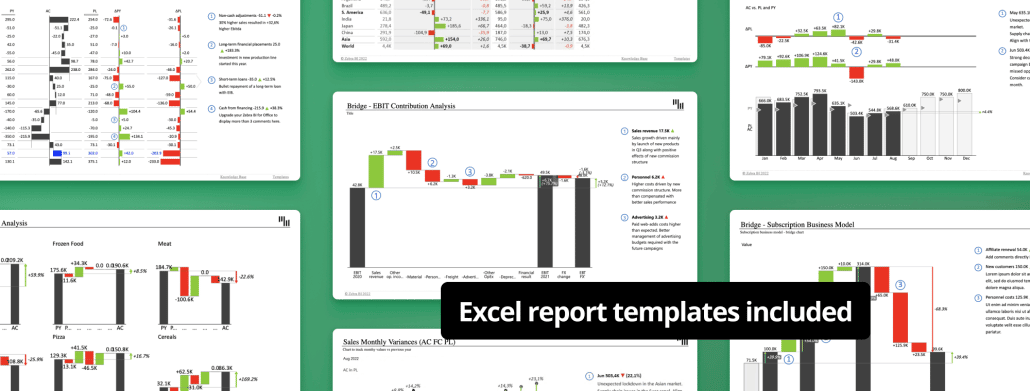
Use a bridge chart to display the performance of your business. Adding custom calculations (e.g., invert, result), dynamic comments & automatic variances you will get additional insights.
Use this template in Excel to visualize the performance of different marketing areas with a bridge chart and identify who is performing according to plan, and who is not, and learn why.
Create an Income statement (P&L) in Excel using a bridge chart, custom calculations (e.g., invert, result), dynamic comments, and automatically calculated variances.
This Excel template explains the reasons behind the revenue growth and presents top contributors for each category with a bridge chart, dynamic comments, and automatic variances.
 September 8th
 February 22nd
 26 Feb 2026