Product: Power BI

January 7, 2019
7 things that you can do in Zebra BI visuals that are hard to do in Power BI
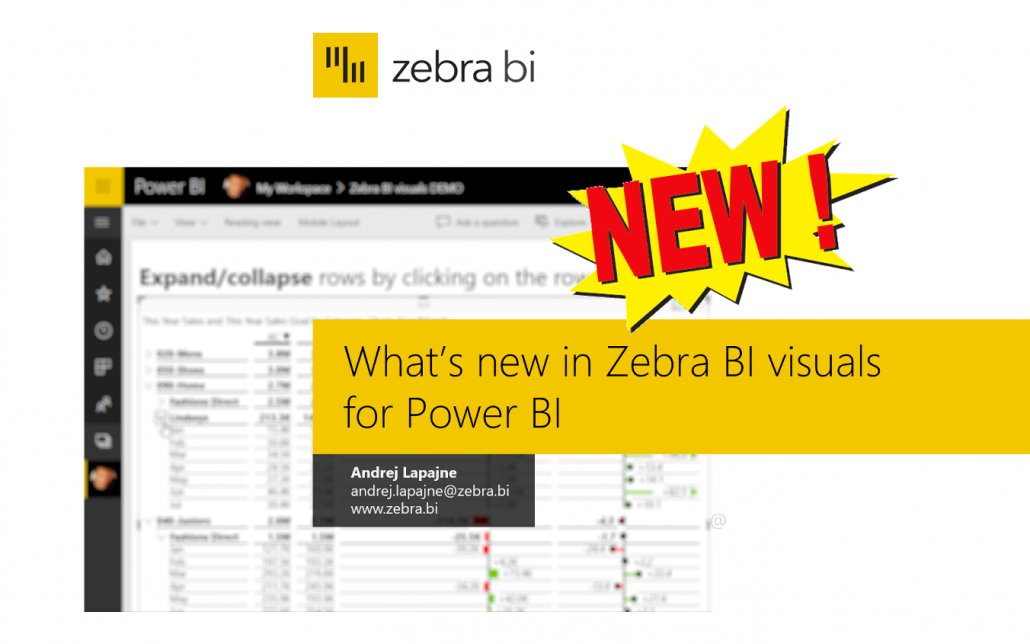
Power BI is a powerful tool for analyzing and visualizing data, but it falls short in some areas. Find out how Zebra BI visuals can make your life easier.
November 27, 2018
What's new in Zebra BI visuals for Power BI – November 2018
Get to know the most important new features of this update, how to use them in practice and how can you benefit from them.
September 4, 2018
Create user-friendly income statements in Power BI
This time we will explain how to use Power BI to design income statements that are user-friendly, easily understandable, and actionable.
August 8, 2018
Mastering Variance Reports in Power BI
We explained the different types of variance reports and how to set them up in Microsoft Power BI to make reports clear and easy-to-understand.
July 30, 2018
Microsoft income statement - FY18 Q4 financial results in Power BI
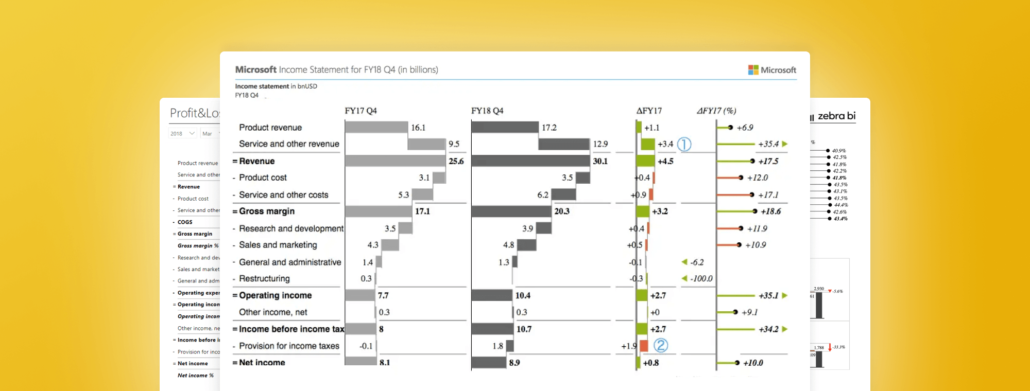
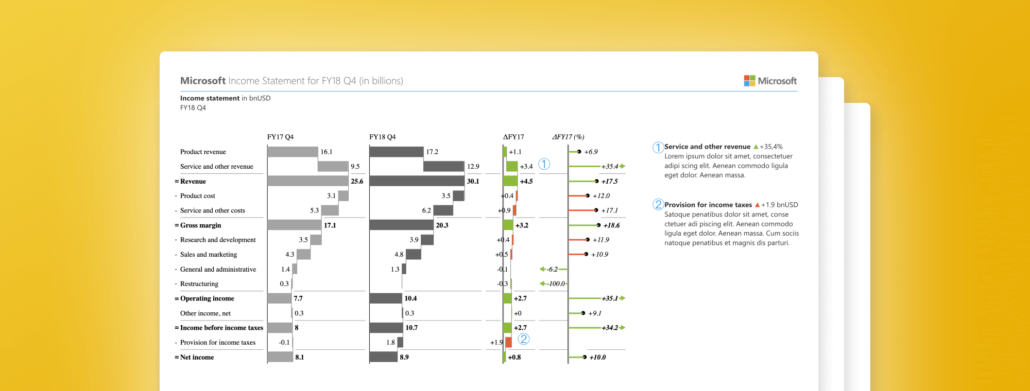
See an example of using Power BI capabilities with the advanced visualization capabilities of Zebra BI used for redesigning Microsoft's income statement.
June 1, 2018
Build Spectacular Power BI Dashboards using Zebra BI custom visuals
Get to knowall of the features that Zebra BI offers and how they contribute to better reporting experience in Power BI.
April 12, 2018
Mastering Variance Reports in Power BI
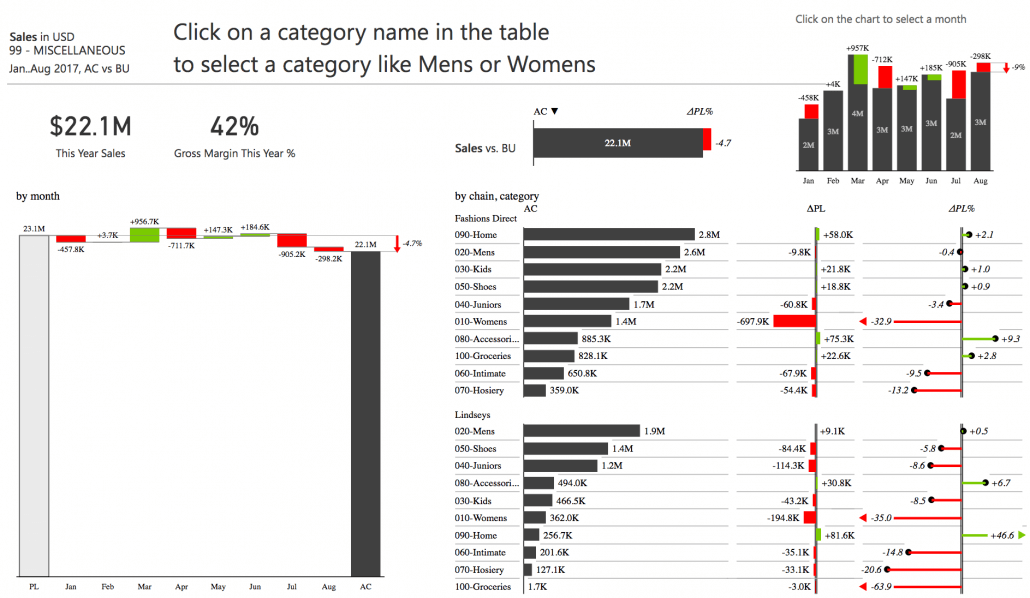
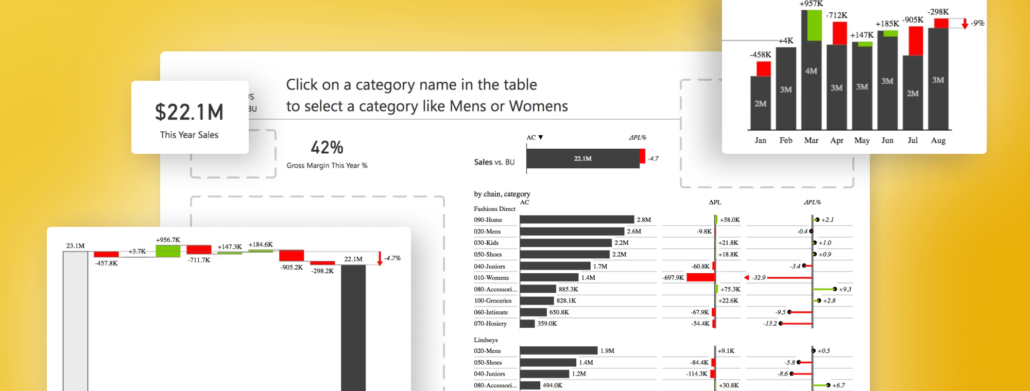
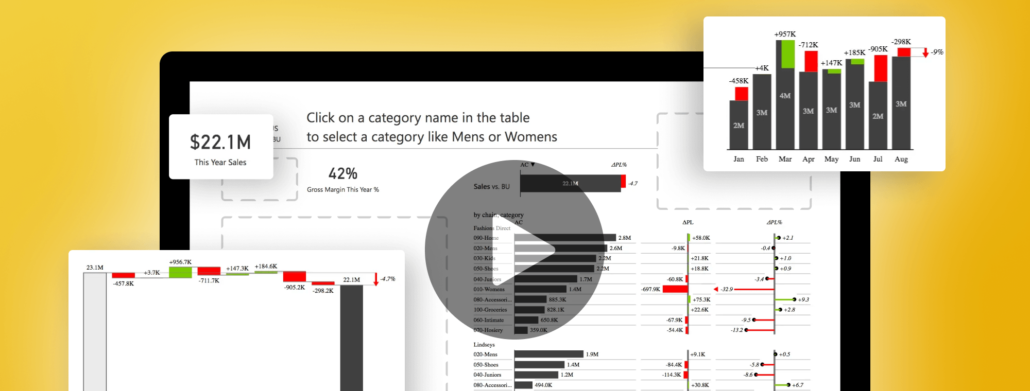
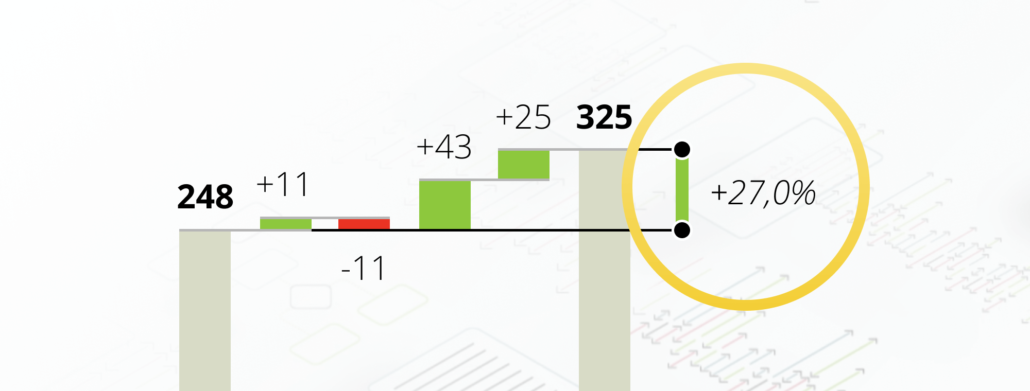
Presenting different variances clearly and in an understandable way is a crucial part of business reporting. Get to know the most effective methods for it in Power BI.
January 17, 2018
Building Spectacular Power BI Dashboards
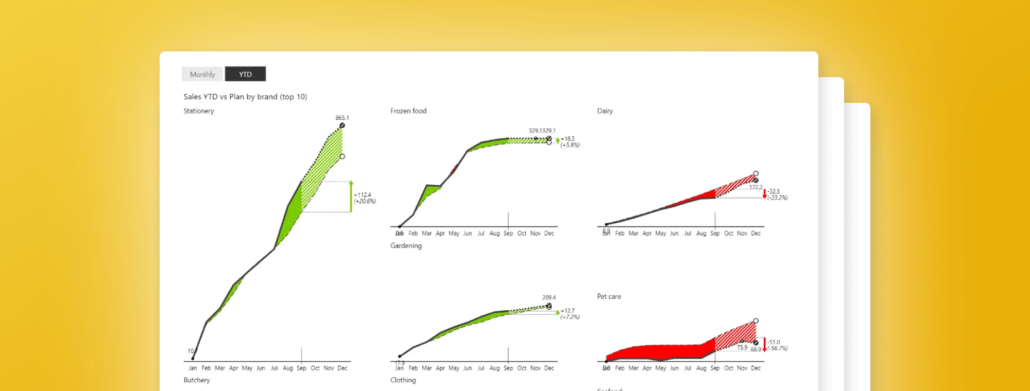
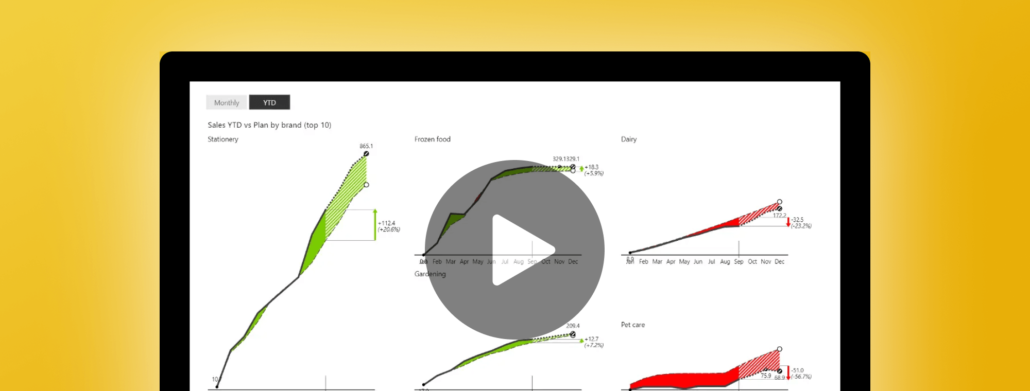
Learn a powerful method for building advanced Power BI dashboards which are compatible with different platforms, fully responsive and easily shareable.
August 18, 2016
Difference highlight: the fastest way to improve your reports and dashboards
Good data visualization removes all unnecessary items and emphasizes the important values. One of the best tools for this is a difference highlight.

Pagination