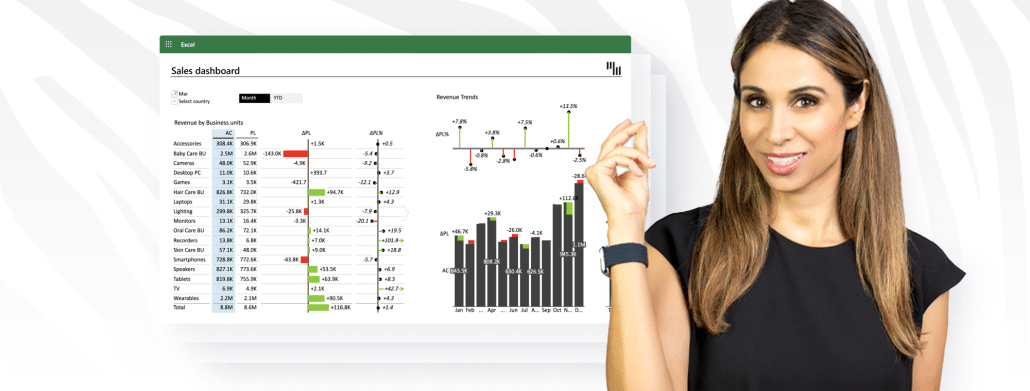
Discover key tips for Excel dashboard creation with Leila Gharani's tutorial and enhance your skills using Zebra BI's advanced tools for optimal analysis.
Explore Zebra BI Tables for efficient report space, clear visuals, and easy use. Ideal for modern business challenges with advanced visuals and IBCS compliance.
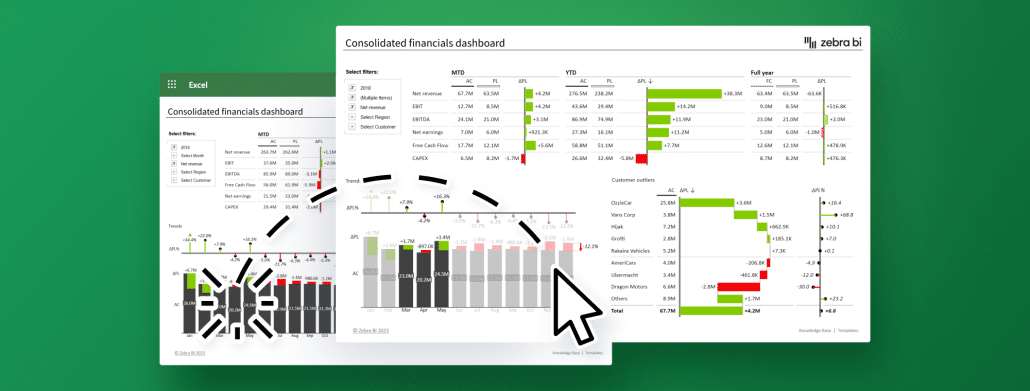
Explore Cross-Visual Filtering in dashboards. Enhance interactive data analysis in Excel & Power BI for sharper insights and informed business choices.
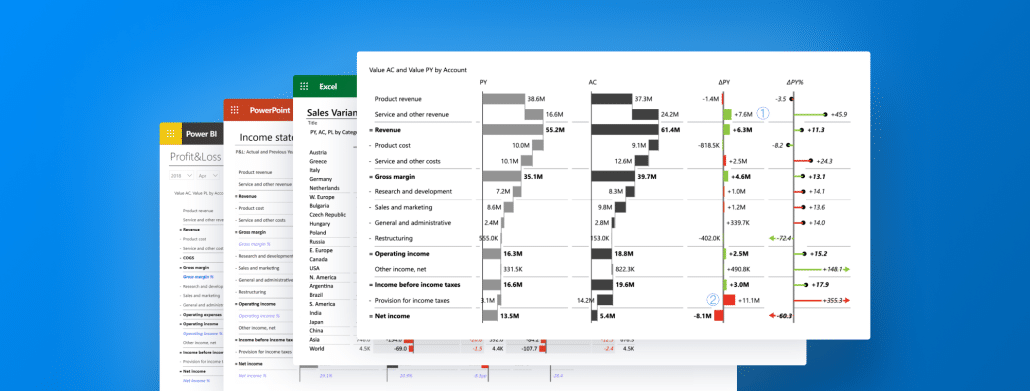
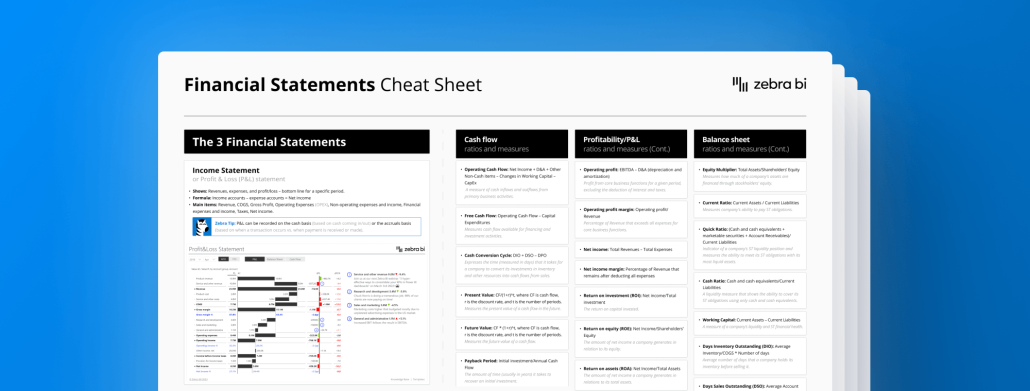
Master the world of financial analysis with our handy financial statements cheat sheet. Your passport to easy understanding of balance sheets, income statements, and more!
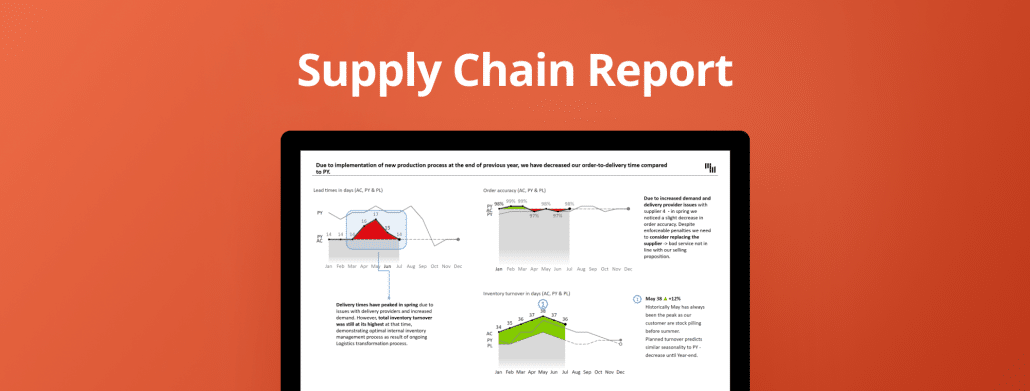
Optimize your operations with our Supply Chain Report PowerPoint Slide Deck, offering dynamic data visualization and performance tracking with Zebra BI for Office.
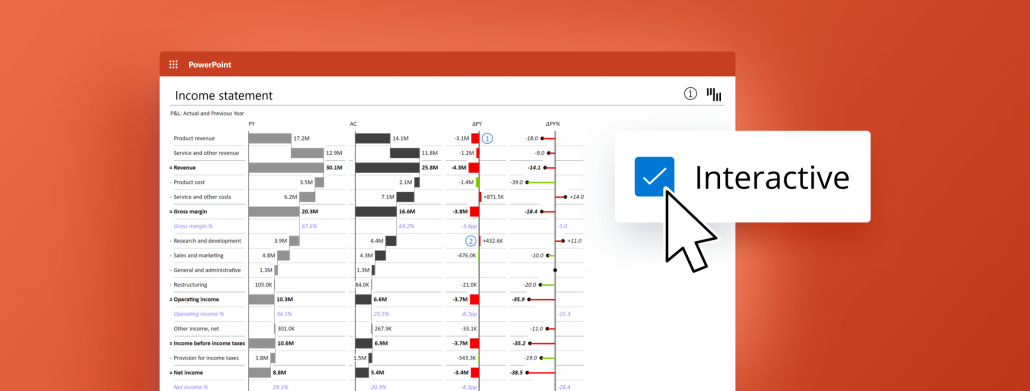
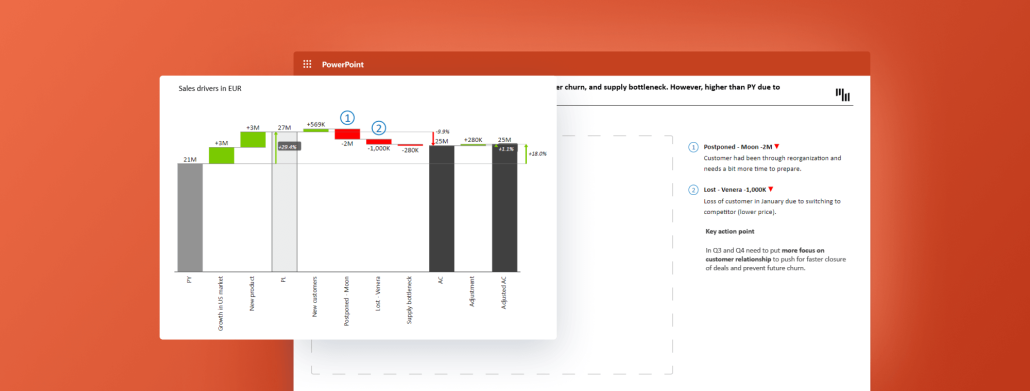
Turn your sales data into compelling narratives with Zebra BI's sales report PowerPoint charts. Craft captivating presentations with interactive, customizable charts that not only speak volumes but also drive insightful, data-driven discussions. Begin your journey towards impactful storytelling today.
 September 8th
 February 22nd