🔥 Don’t miss the best offers of the year!
Get VIP Access Now

Topic: Business

March 25, 2022
Sales Funnel Power BI Template
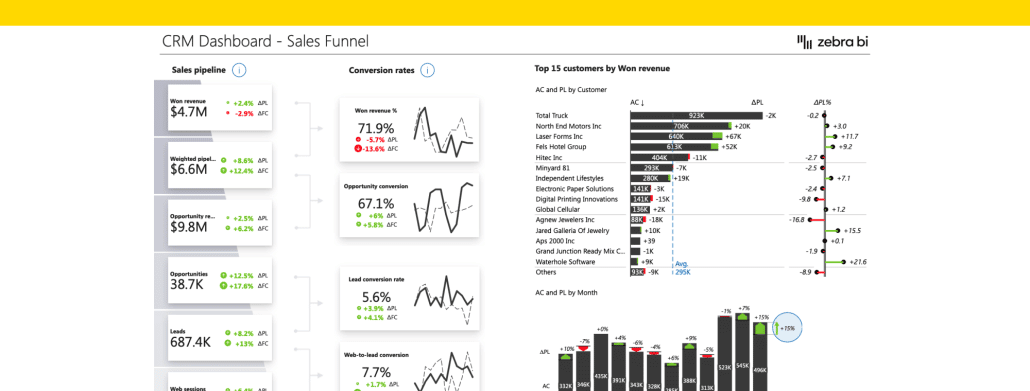
The Sales Funnel template for Power BI lets you display your most important KPIs on one page. Simply, track your conversations, understand your sales performance and how your pipeline is looking at all times.
Advanced
February 21, 2022
Price Volume Mix Analysis in Excel
This Price Volume Mix Analysis template enables you to have complete insight into what is driving the changes that you're seeing.
December 14, 2021
Supercharge your Power BI dashboards to drive action
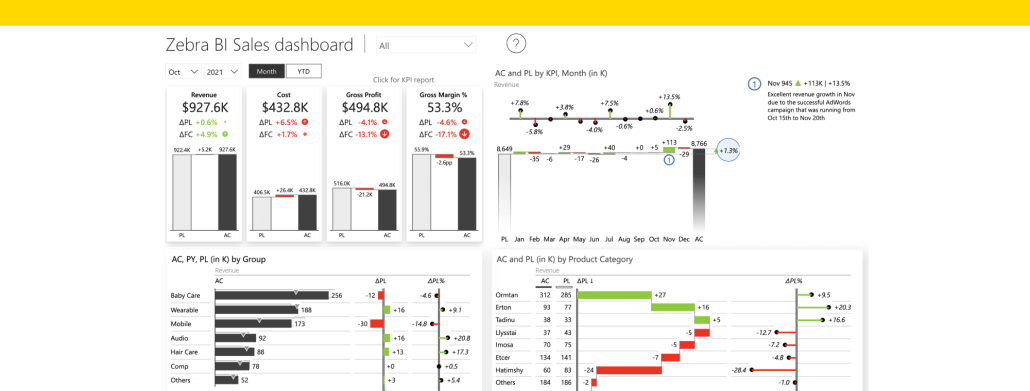
Start making decisions, based on data: from the concepts of Actionable Reporting to creating a winning landing page in Power BI. And grabbing attention where it matters.
September 23, 2021
Choosing the correct chart for your Power BI report
In this live session, we'll guide you through the 3 fundamental rules that you should always follow when creating charts.
June 24, 2021
Real-World Story: KPN crushes board meetings with powerful dashboards
Learn first hand how KPN managed to transform their board room meetings with actionable reports thanks to Power BI and Zebra BI.
June 7, 2021
Sales Dashboard in Power BI Template
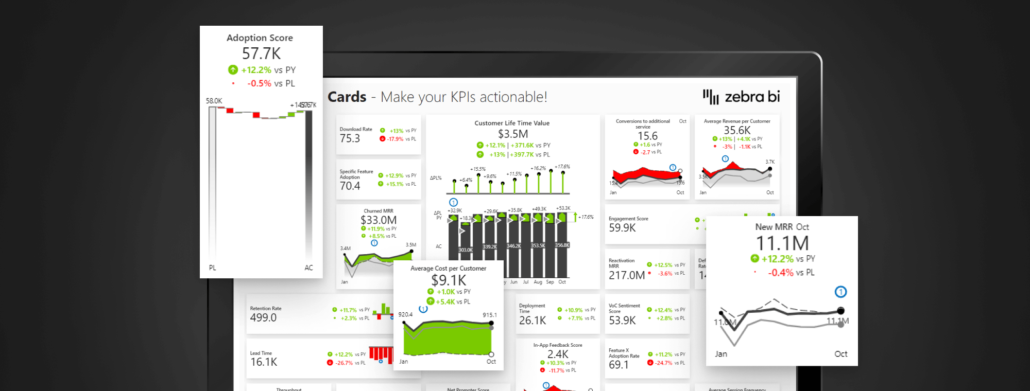
This Power BI template is designed to help you make an actionable Sales Dashboard. It includes all the essential elements and other Power BI dashboarding tips & tricks.
June 7, 2021
Income Statement Power BI Template
This Zebra BI template is designed to help you structure, create, and design a user-friendly, insightful Income Statement Dashboard in Power BI.
June 7, 2021
Price-Volume-Mix Variance Analysis template in Power BI
This Power BI example explains the reasons behind the revenue growth and presents top contributors for each category.
Advanced
June 7, 2021
Z-Chart in Excel
This advanced Excel template uses a combination of charts to visualize monthly AC, BU and FC data in a distinct Z shape.