Product
Zebra BI for Power BI
Product overview
Create advanced reports in Power BI
Zebra BI Tables
World's most powerful matrix
Zebra BI Charts
One visual, many charts
Zebra BI Cards
Incredibly flexible KPI scorecards
Why Zebra BI?
Supercharge your Power BI
Take product tour
Zebra BI for Excel
Product overview
Create advanced reports in Excel
Customers
Resources
Resource Hub
Game changing tips to uncover insights
Guides
How to build actionable dashboards
Webinars
New
Upcoming and on-demand video sessions
Templates
Useful inspiration for your reports
Blog
Get in the know
Events
Join us at community events
Help
Help Center
Explore updates & other product resources
Power BI Knowledge Base
Library of information for Power BI visuals
Excel Knowledge Base
Library of information for Excel add-in
101 Crash Course
Build your first dashboard
Chart Selector
Find the right chart for your data
Contact Support
We’re here to help
Pricing
Log In
Try for Free
Products
Zebra BI for Power BI
Product overview
Create advanced reports in Power BI
Zebra BI Tables
World's most powerful matrix
Zebra BI Charts
One visual, many charts
Zebra BI Cards
Incredibly flexible KPI scorecards
Why Zebra BI?
Supercharge your Power BI
Take product tour
Zebra BI for Excel
Product overview
Create advanced reports in Excel
Customers
Resources
Resource Hub
Game changing tips to uncover insights
Guides
How to build actionable dashboards
Webinars
New
Upcoming and on-demand video sessions
Templates
Useful inspiration for your reports
Blog
Get in the know
Events
Join us at community events
Help
Help Center
Explore updates & other product resources
Power BI Knowledge Base
Library of information for Power BI visuals
Excel Knowledge Base
Library of information for Excel add-in
101 Crash Course
Build your first dashboard
Chart Selector
Find the right chart for your data
Contact Support
We’re here to help
Pricing
Log In
Try for Free
Home
Templates
Z-Chart in Excel
Updated:
September 10, 2021
Z-Chart in Excel
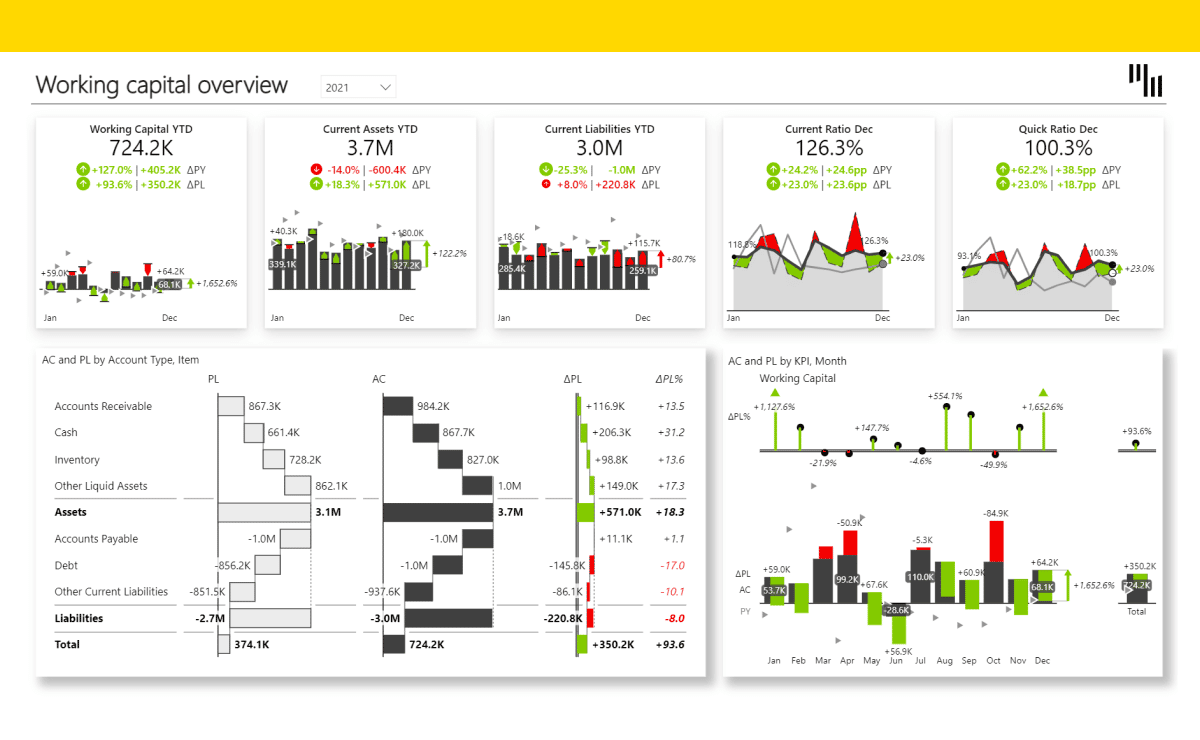
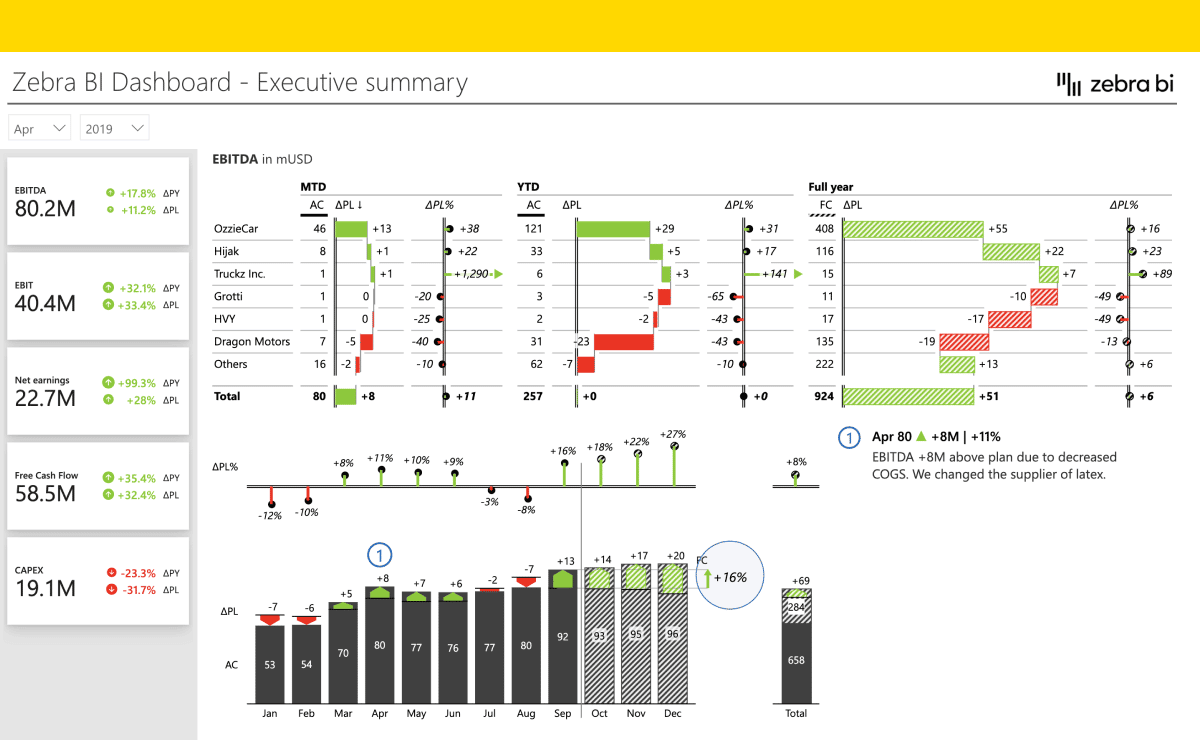
This advanced Excel template uses a combination of charts to visualize monthly AC, BU and FC data in a distinct Z shape.
Try it in your Excel!
Hidden
Product
pbi
excel
First name
*
Last name
*
Email
*
Company
*
Country
*
Country *
United States
Afghanistan
Albania
Algeria
American Samoa
Andorra
Angola
Antigua and Barbuda
Argentina
Armenia
Australia
Austria
Azerbaijan
Bahamas
Bahrain
Bangladesh
Barbados
Belarus
Belgium
Belize
Benin
Bermuda
Bhutan
Bolivia
Bosnia and Herzegovina
Botswana
Brazil
Brunei
Bulgaria
Burkina Faso
Burundi
Cambodia
Cameroon
Canada
Cape Verde
Cayman Islands
Central African Republic
Chad
Chile
China
Colombia
Comoros
Congo, Democratic Republic of the
Congo, Republic of the
Costa Rica
Côte d'Ivoire
Croatia
Cuba
Cyprus
Czech Republic
Denmark
Djibouti
Dominica
Dominican Republic
East Timor
Ecuador
Egypt
El Salvador
Equatorial Guinea
Eritrea
Estonia
Ethiopia
Faroe Islands
Fiji
Finland
France
French Polynesia
Gabon
Gambia
Georgia
Germany
Ghana
Greece
Greenland
Grenada
Guam
Guatemala
Guinea
Guinea-Bissau
Guyana
Haiti
Honduras
Hong Kong
Hungary
Iceland
India
Indonesia
Iran
Iraq
Ireland
Israel
Italy
Jamaica
Japan
Jordan
Kazakhstan
Kenya
Kiribati
North Korea
South Korea
Kosovo
Kuwait
Kyrgyzstan
Laos
Latvia
Lebanon
Lesotho
Liberia
Libya
Liechtenstein
Lithuania
Luxembourg
Macedonia
Madagascar
Malawi
Malaysia
Maldives
Mali
Malta
Marshall Islands
Mauritania
Mauritius
Mexico
Micronesia
Moldova
Monaco
Mongolia
Montenegro
Morocco
Mozambique
Myanmar
Namibia
Nauru
Nepal
Netherlands
New Zealand
Nicaragua
Niger
Nigeria
Northern Mariana Islands
Norway
Oman
Pakistan
Palau
Palestine, State of
Panama
Papua New Guinea
Paraguay
Peru
Philippines
Poland
Portugal
Puerto Rico
Qatar
Romania
Russia
Rwanda
Saint Kitts and Nevis
Saint Lucia
Saint Vincent and the Grenadines
Samoa
San Marino
Sao Tome and Principe
Saudi Arabia
Senegal
Serbia
Seychelles
Sierra Leone
Singapore
Sint Maarten
Slovakia
Slovenia
Solomon Islands
Somalia
South Africa
Spain
Sri Lanka
Sudan
Sudan, South
Suriname
Swaziland
Sweden
Switzerland
Syria
Taiwan
Tajikistan
Tanzania
Thailand
Togo
Tonga
Trinidad and Tobago
Tunisia
Turkey
Turkmenistan
Tuvalu
Uganda
Ukraine
United Arab Emirates
United Kingdom
Uruguay
Uzbekistan
Vanuatu
Vatican City
Venezuela
Vietnam
Virgin Islands, British
Virgin Islands, U.S.
Yemen
Zambia
Zimbabwe
Consent to communicate - Product
*
I agree to get instant access to Zebra BI custom visuals and receive onboarding content during the next 30-days with useful suggestions on how to properly use the visuals.*
*
Consent to communicate - General
I'd love to receive more educational content and latest updates about Actionable reporting and Zebra BI.
Consent to process data
*
I have read and agree to
End-user license agreement
.*
*
Comments
This field is for validation purposes and should be left unchanged.
Visuals for Power BI
Product Overview
Product Tour Video
Zebra BI Tables
Zebra BI Charts
Zebra BI Cards
Templates (PBIX)
Help Center for Power BI
Changelog
Why Zebra BI?
Pricing
Log in
Add-in for Excel
Product Overview
Templates (XLSX)
Help Center for Excel
Pricing
Resources
Webinars
Templates
Guides
Blog
Help Center
Zebra BI 101 Crash Course
Chart Selector
Company
About
Careers
Customers
Certified Partners
Terms of Website Use
Contact us
© 2021 – 2022 Copyright ZebraBI d.o.o. All rights reserved. Various trademarks held by their respective owners.
Privacy Policy
Legal documentation
Visuals for Power BI
Product Overview
Product Tour Video
Zebra BI Tables
Zebra BI Charts
Zebra BI Cards
Templates (PBIX)
Help Center for Power BI
Changelog
Why Zebra BI?
Pricing
Log in
Add-In for Excel
Product Overview
Templates (XLSX)
Help Center for Excel
Pricing
Resources
Webinars
Templates
Guides
Blog
Help Center
Zebra BI 101 Crash Course
Chart Selector
Company
About
Careers
Customers
Certified Partners
Terms of Website Use
Contact us
© 2021 – 2022 Copyright ZebraBI d.o.o. All rights reserved. Various trademarks held by their respective owners.
Privacy Policy
Legal documentation
angle-down
youtube-play
dropdown-down
TimelineArrow
facebook
ln
logo-black
menu
product-excel
twitter