Cracking the code: What are liquidity ratios & how to present them effectively?
PRO Trial
Roll up your sleeves and dust off your calculator, dear financial guru. We're about to embark on a thrilling journey through the land of liquidity ratios. Now, you might be thinking, "Thrilling? Liquidity ratios?" But we promise, once you see the intricate dance of numbers and business insight these seemingly innocuous ratios can deliver, you'll understand why we're this excited.
By the end of this guide, you'll be wielding your liquidity ratio knowledge like a true financial wizard, illuminating the path towards better business decisions for your company. So, buckle up as we delve into the tantalizing world of current ratios, quick ratios, and more. Let's put some edge to your financial savvy, shall we?
The what, why and wow of liquidity ratios
Imagine a world-class juggler performing an intricate routine. They keep the balls in the air with grace, ensuring none of them hit the ground. That's liquidity in a nutshell – it’s all about keeping the business balls in the air and maintaining a perfect balance.
Liquidity, for the uninitiated, is the financial acrobat that turns assets into cash quickly and without losing value. It's like the choreographer who keeps the business ballet moving harmoniously, making sure funds are at the ready to cover expenses, fulfill obligations to vendors, and meet payroll requirements, all while sidestepping the pitfalls of short-term debts.
But here's the twist: it's not just the cash that's doing the juggling act. Stocks and bonds, the high-wire artists of the asset world, are also considered liquid as they can be converted to cash with relative ease. Still, the undeniable star of the show is cash itself. Why? Simply put, cash never fails to impress – everyone accepts it, no questions asked.
Now, you might ask, "Why is this juggling act so important?" Here's the punchline: without liquidity, a business is like a juggler with buttered fingers, dropping balls left and right. This could lead to solvency problems, strained relationships with vendors, and unhappy employees – certainly not the grand finale you'd hope for. But a business that maintains its liquidity is like a star performer, effortlessly navigating challenges and stealing the show. So, let's applaud the true hero of the financial circus that is liquidity!
Types of liquidity ratios
Alright, let's pull back the curtain on liquidity and its all-star cast – the 'liquidity ratios'. Think of them as a finely tuned orchestra, each ratio playing its unique part, all harmoniously working together to provide a detailed picture of a company's short-term financial strength.
Let's meet our maestros.
1. The Current Ratio
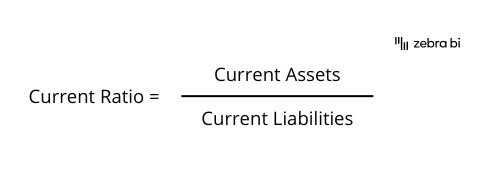
First up, we have the current ratio, the cornerstone of liquidity ratios. It measures a company's ability to meet its short-term financial obligations. By comparing current assets (like cash, inventory, and accounts receivable) to current liabilities (such as bills, loans, and upcoming payments), this ratio offers insights into whether a company has enough resources to cover its debts. A higher current ratio? That's like hitting the perfect high note - it indicates robust financial health and the ability to handle short-term obligations with ease.
2. The Quick Ratio
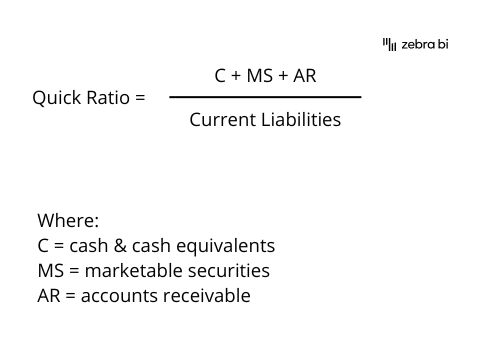
Next, we have the quick ratio, also known as the acid-test ratio. Imagine this as the bass player in our orchestra, offering a more profound, stripped-down perspective. This ratio excludes inventory from the current assets, as it might take time to sell and convert into cash. Instead, it focuses on assets that can quickly turn into cash, such as cash on hand, short-term investments, and accounts receivable. It offers a no-nonsense view of a company's ability to pay off its short-term obligations without relying on inventory sales. A higher quick ratio? That's akin to a flawless bass solo, indicating that the company is agile and ready to tackle any short-term financial challenges.
Each of these ratios plays a vital role in the financial orchestra, helping us evaluate the liquidity, solvency, and overall financial leverage of a business. So, let's strike up the band and use these financial maestros to compose your symphony of business success!
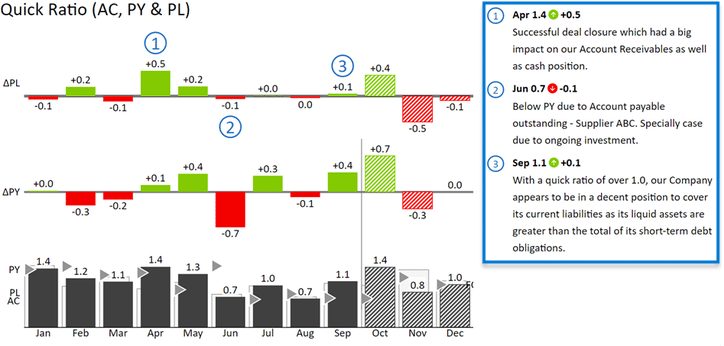
How to present liquidity ratios to your C-levels? Visualize them!
Once you've mastered your liquidity ratios and crunched those all-important numbers, it's time to let them shine in all their glory. By visualizing these figures, you're not merely presenting data, you're showcasing insights that can be understood at a glance. Think of it as the difference between hearing an orchestra tuning their instruments versus performing a symphony - it's all about harmony and clarity.
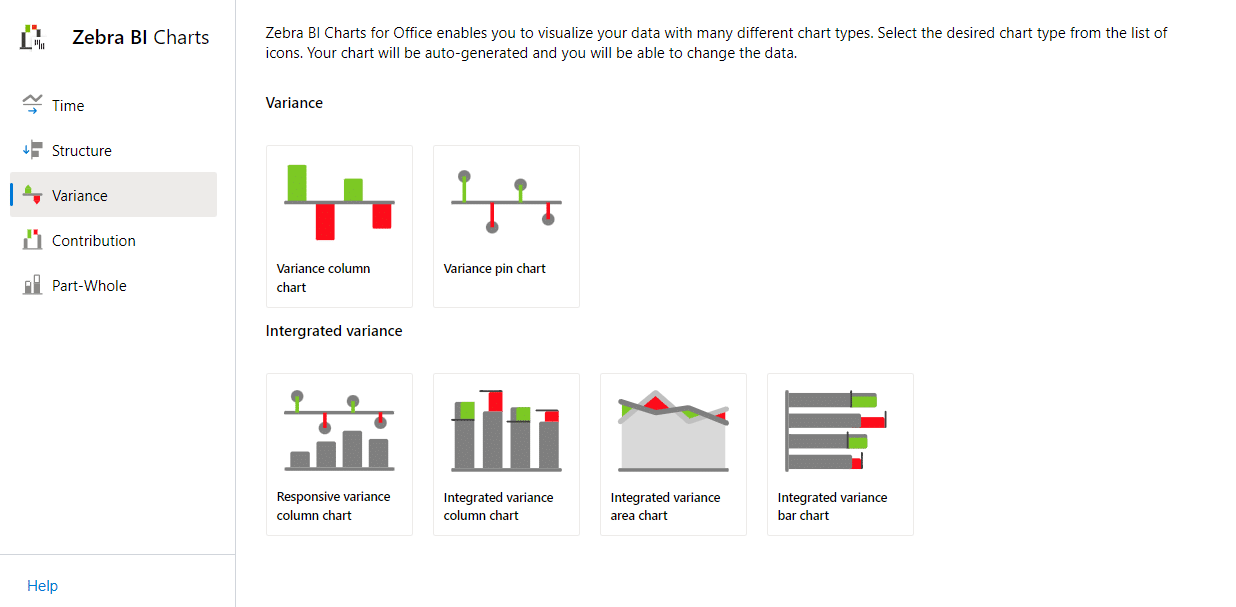
Choose the Right Chart
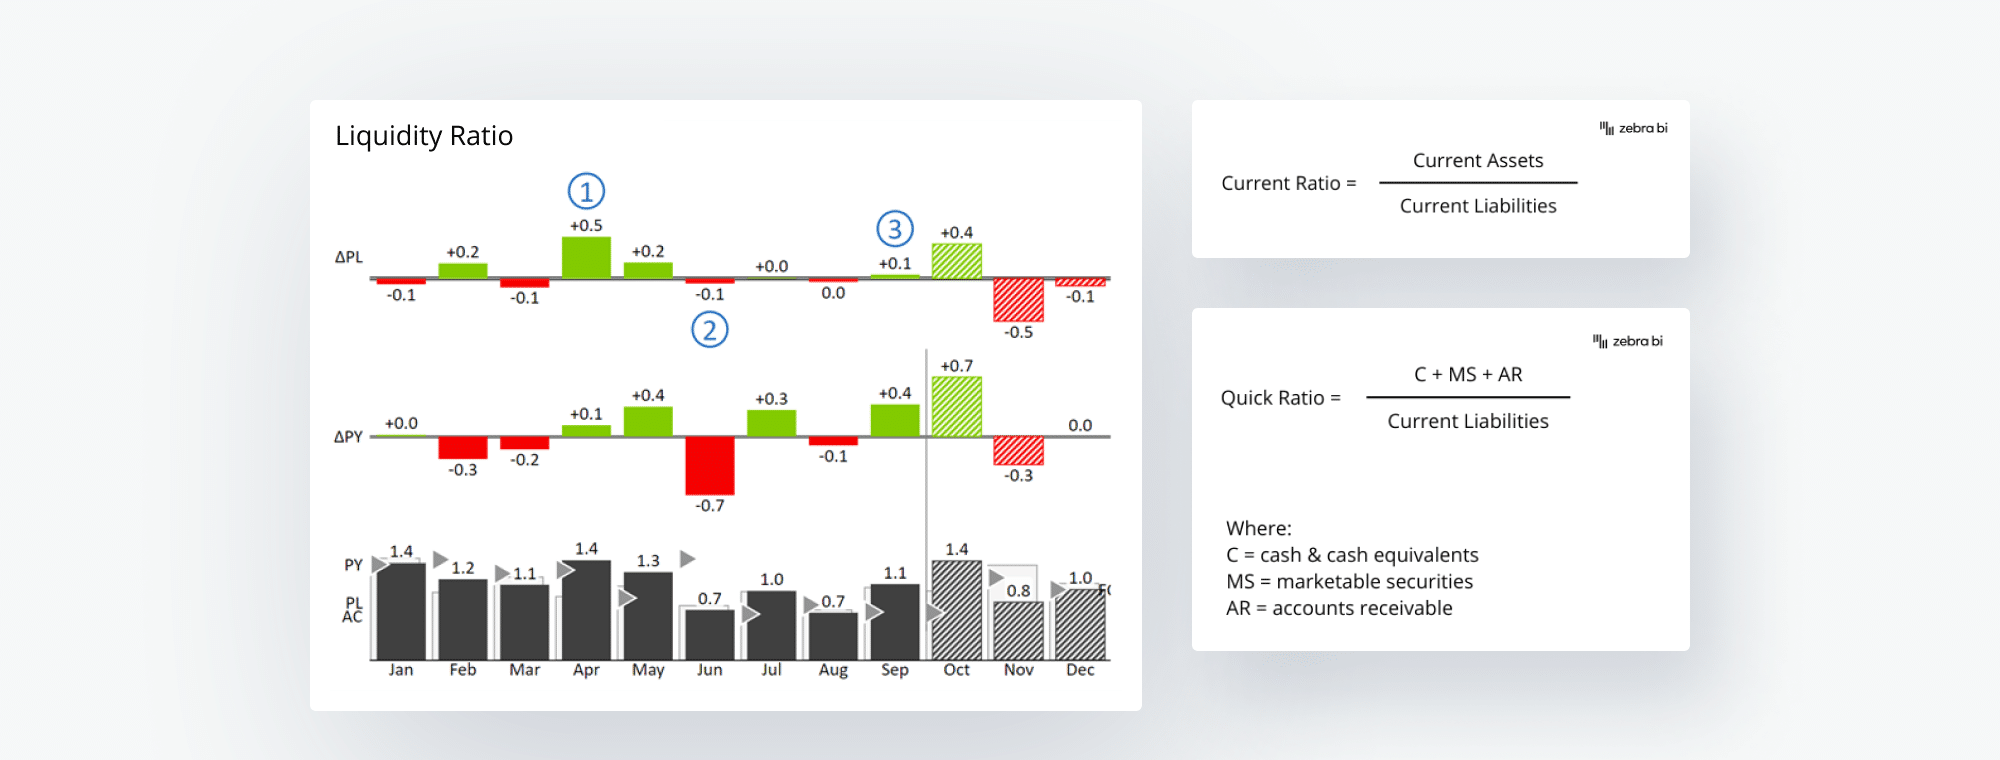
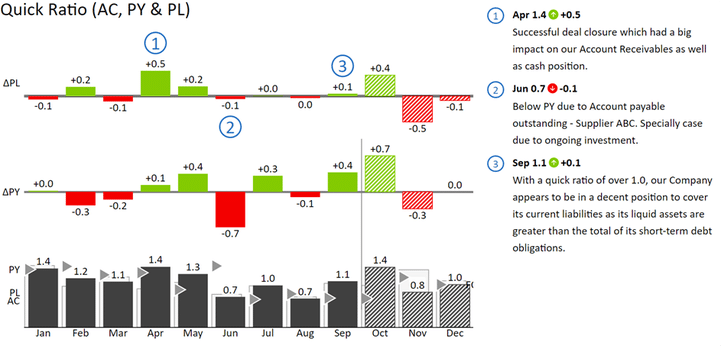
The right chart is like the perfect melody, making the complex understandable. For your liquidity ratios, we suggest going for an integrated variance chart. This chart lets you compare current figures against past performance, plans or future forecasts, illustrating the trends as clearly as the crescendo in a musical masterpiece.
Make it IBCS-Compliant
Consistency in reporting is as crucial as maintaining rhythm in a composition. Adopting IBCS-compliant visuals ensures your reports are as intuitive, clear, and easily interpreted as a well-written score. With Zebra BI, you can ensure this level of consistency, making your data as harmonious as a finely tuned orchestra.
Add Comments
A well-placed comment on your visual is like the soloist that amplifies the story behind your data. These annotations can illuminate trends and preempt questions, adding depth and context to your masterpiece.
In essence, visualizing your data does more than merely presenting numbers; it transforms your liquidity ratio analysis into a performance that resonates with your audience. It's not about showing data; it's about narrating a compelling story, one where insights take center stage. With Zebra BI, you're not just putting your data on display, you're conducting a symphony of insights that even your CFO and CEO will applaud. Cue the standing ovation for your data-driven performance!
Create your liquidity ratio presentation with just a few clicks
Imagine if creating top-notch financial reports and presentations was as easy as snapping your fingers. No need to imagine, because with Zebra BI, it's precisely that simple. Zebra BI turns crunching & presenting your data from a chore into a charmingly efficient process both in Excel and PowerPoint. With its user-friendly interface, powerful visualization tools, and IBCS compliance, it takes your raw data & turns it into a engaging narrative, making you the maestro of your financial symphony.
So, buckle up and get ready to impress your audience with your next performance, courtesy of Zebra BI.
Make your next liquidity ratio presentation a complete masterpiece
Your audience is eager for insights, and with Zebra BI, you can deliver just that – easier and faster than ever. Grab it for free & see first-hand how it can transform your data presentation game.