September 8th
 February 22nd
 04 Jun 2026
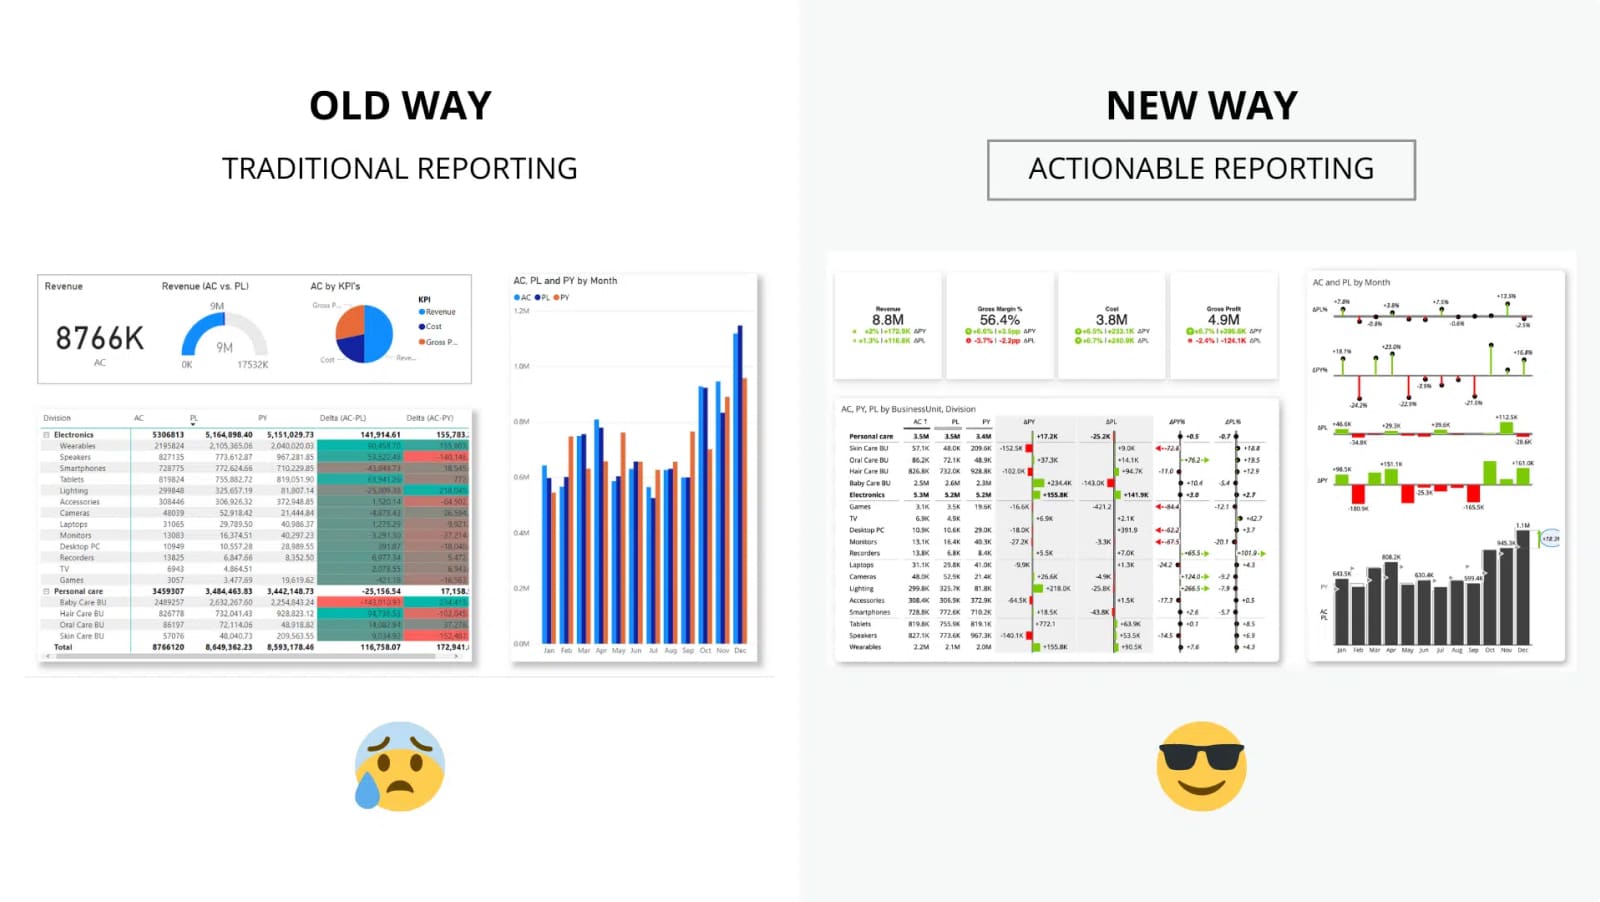
 To make sense of the record-breaking amounts of data available, you need proper tools. When you use Zebra BI visuals, you will be able to answer the key questions:
1. How we are performing?
2. Whether it is good or bad?
3. How good or bad it is?
4. Why, and what we will do about it?
The paradigm is called Actionable Reporting and it's time you start implementing it at your company.
If you're looking for more advanced visualizations, look no further than Zebra BI.
World's leading data visualization software designed to transform complex financial and business data into clear, actionable insights.
Our intuitive solutions/visuals make it easy to create clear, insightful, and actionable reports and dashboards.
Enjoy a seamless cross-platform experience with Zebra BI across Power BI, Excel, and PowerPoint.
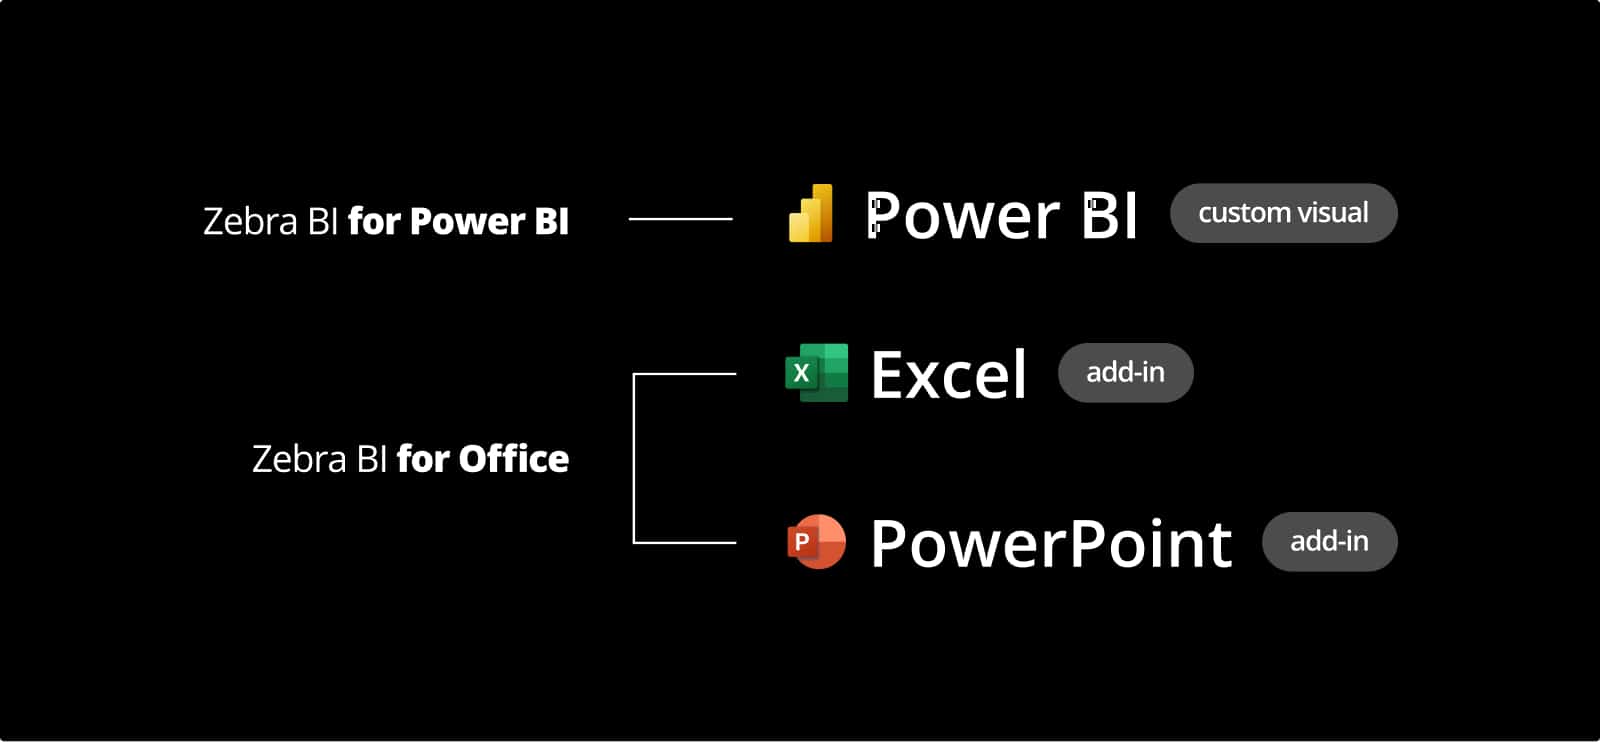
You'll love Zebra BI because of its consistent design, intuitive navigation, and powerful features, no matter what platform you use.
With Zebra BI you will save time while creating reports that show just the insights you need to make the right decisions.
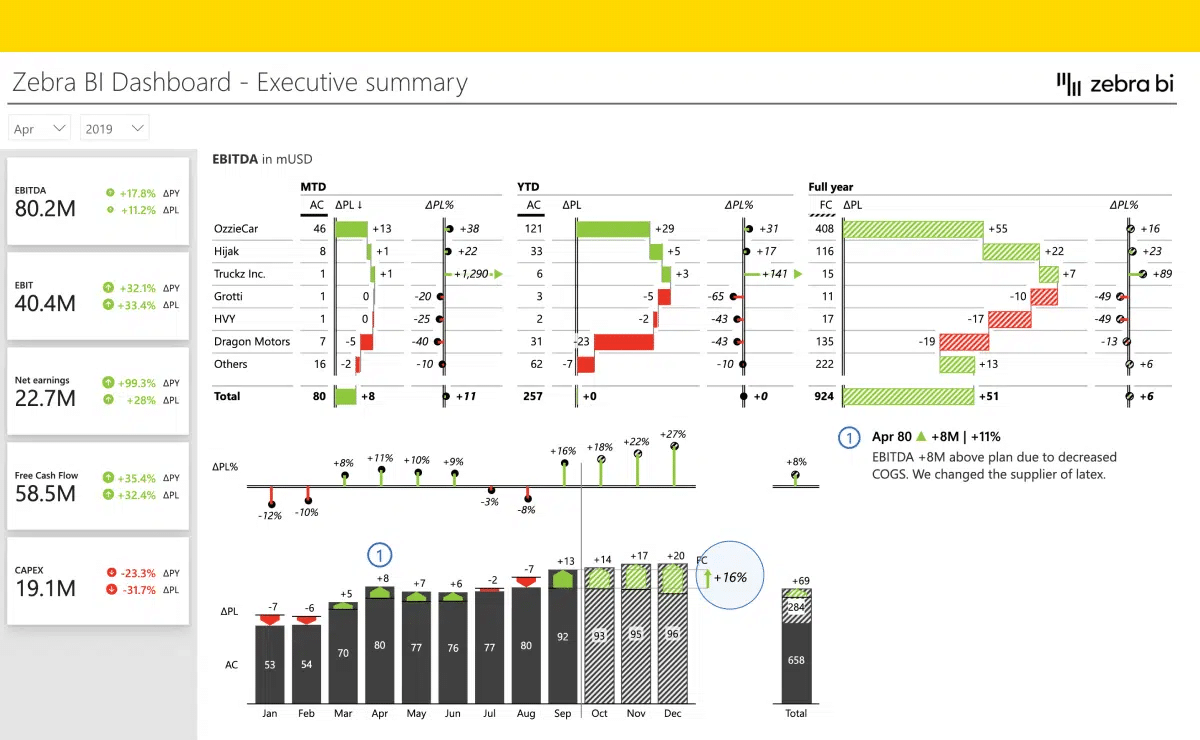
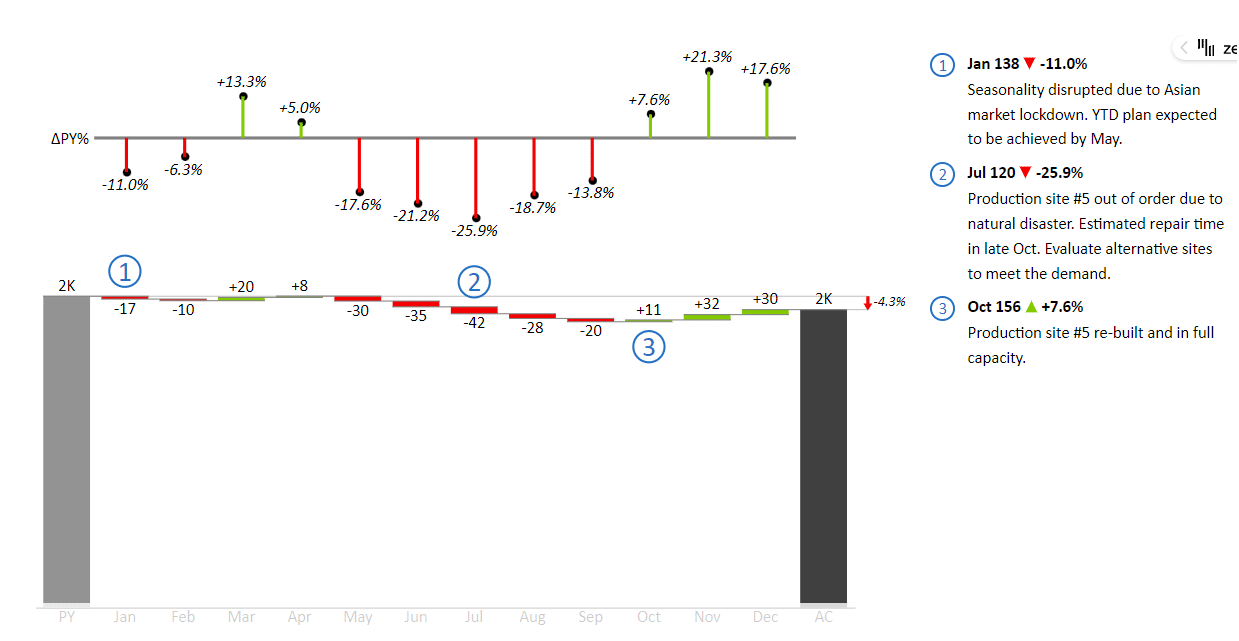
Don't just show numbers, show them compared to your plan, previous year, and forecast.
The automatically calculated relative and absolute variances will provide immediate visual information about your performance compared to targets.
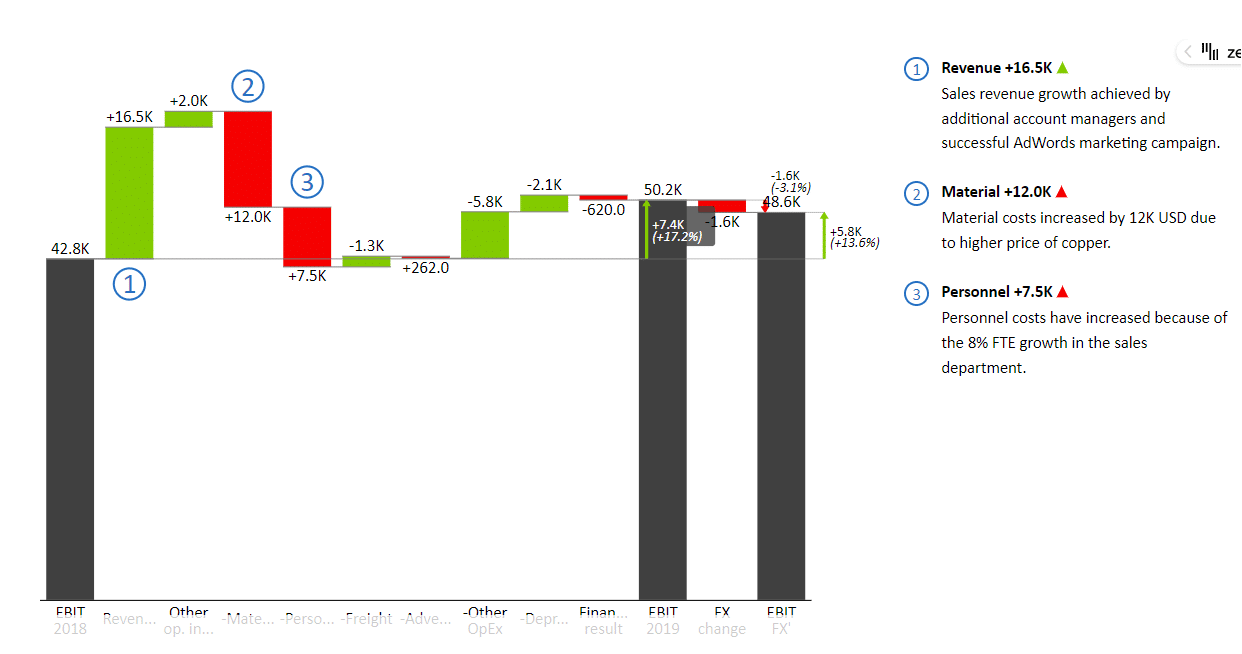
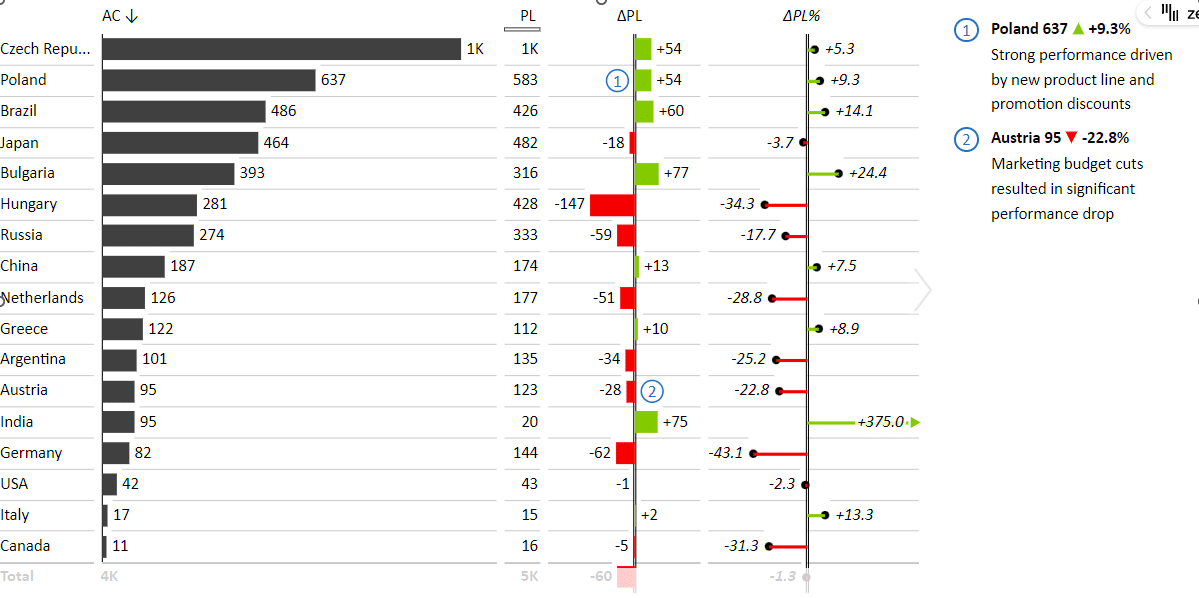
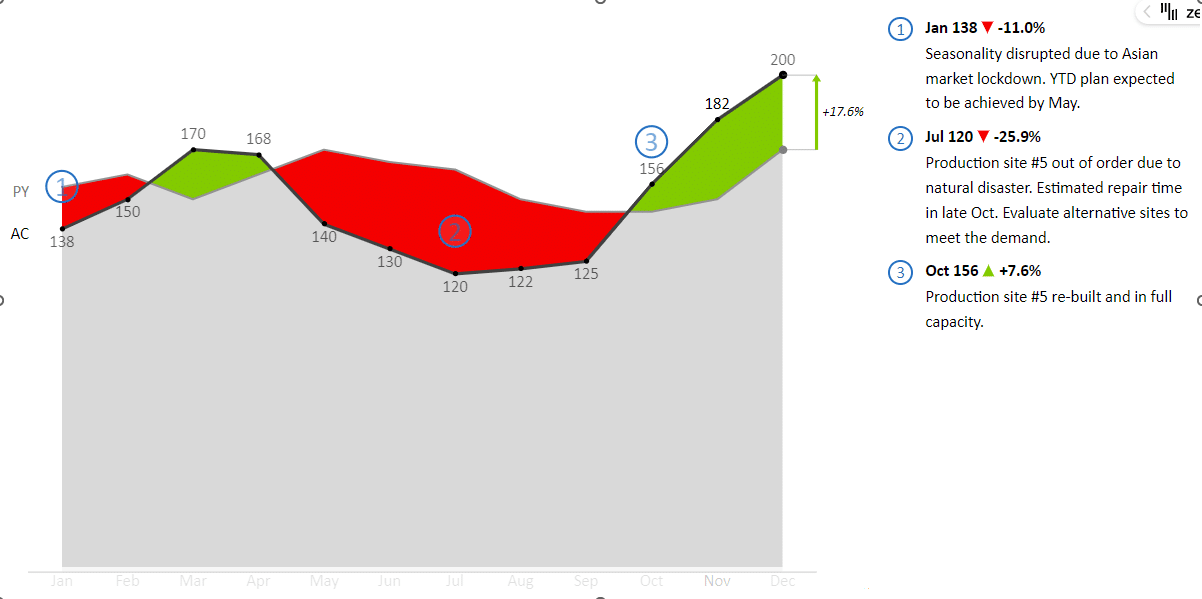
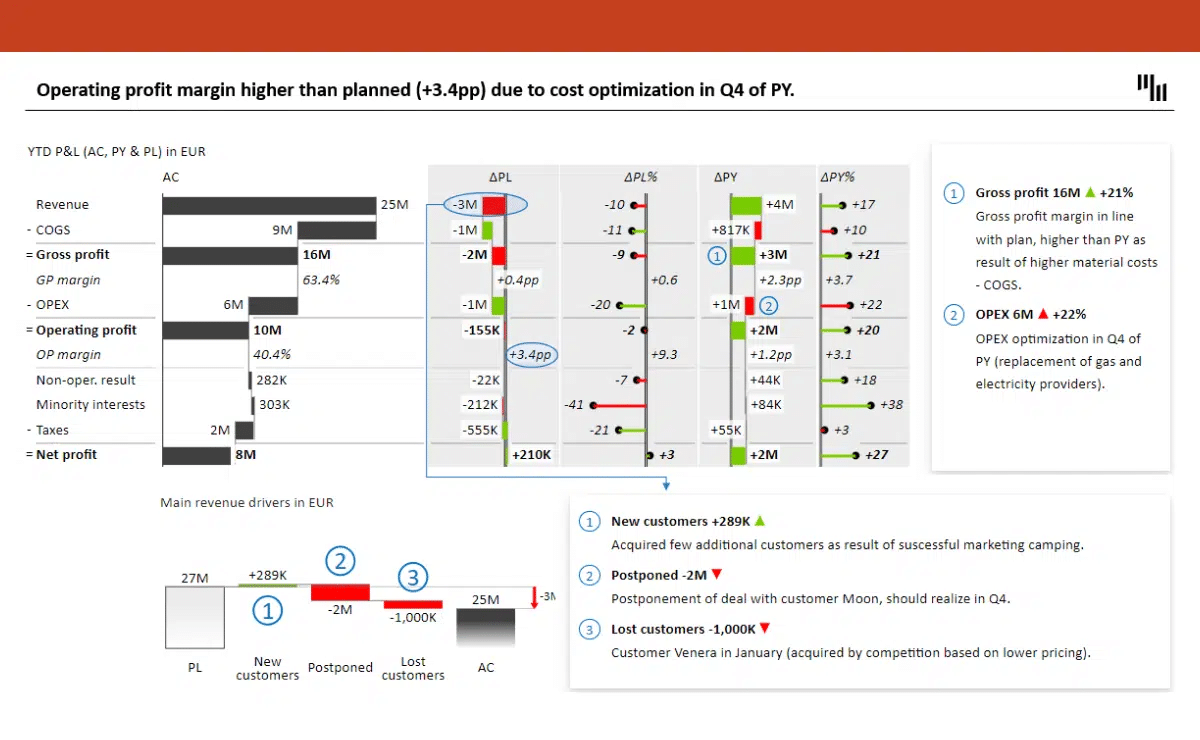
Once your performance is clear, you will probably notice some changes in the data where you will ask yourself (or others): why has this happened?
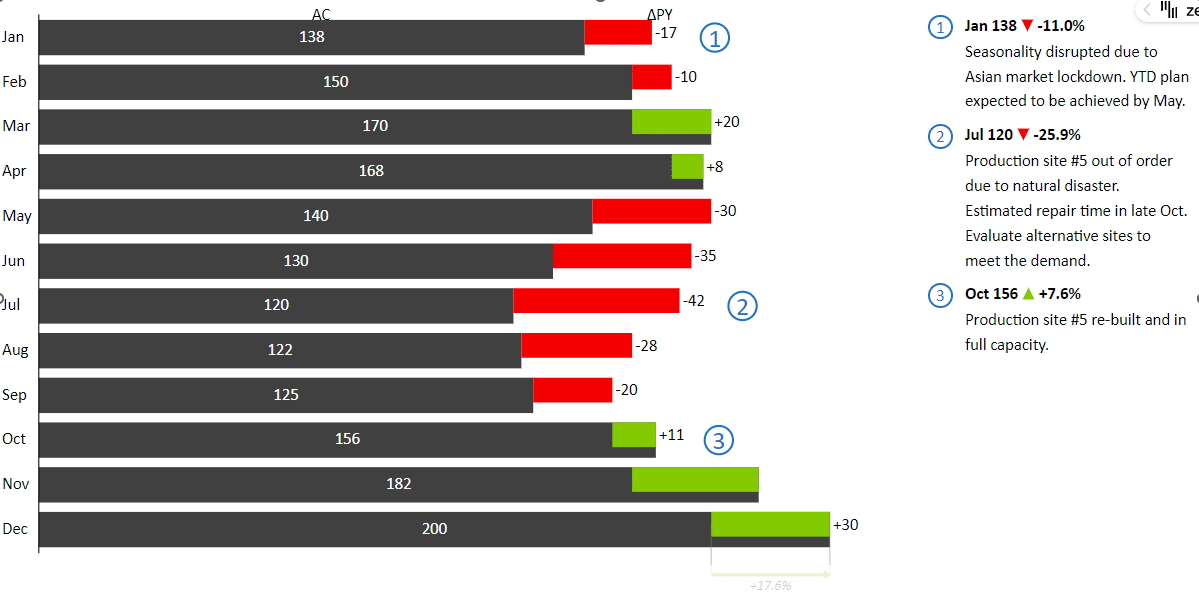
No need to dive back into data and prolong decision-making. Simply insert comments into your data source and see them appear directly on the visual.
Explore additional design settings that will help you adjust the look and feel of the comments to match your needs best.
Transform hours into minutes with Zebra BI's fast reporting.
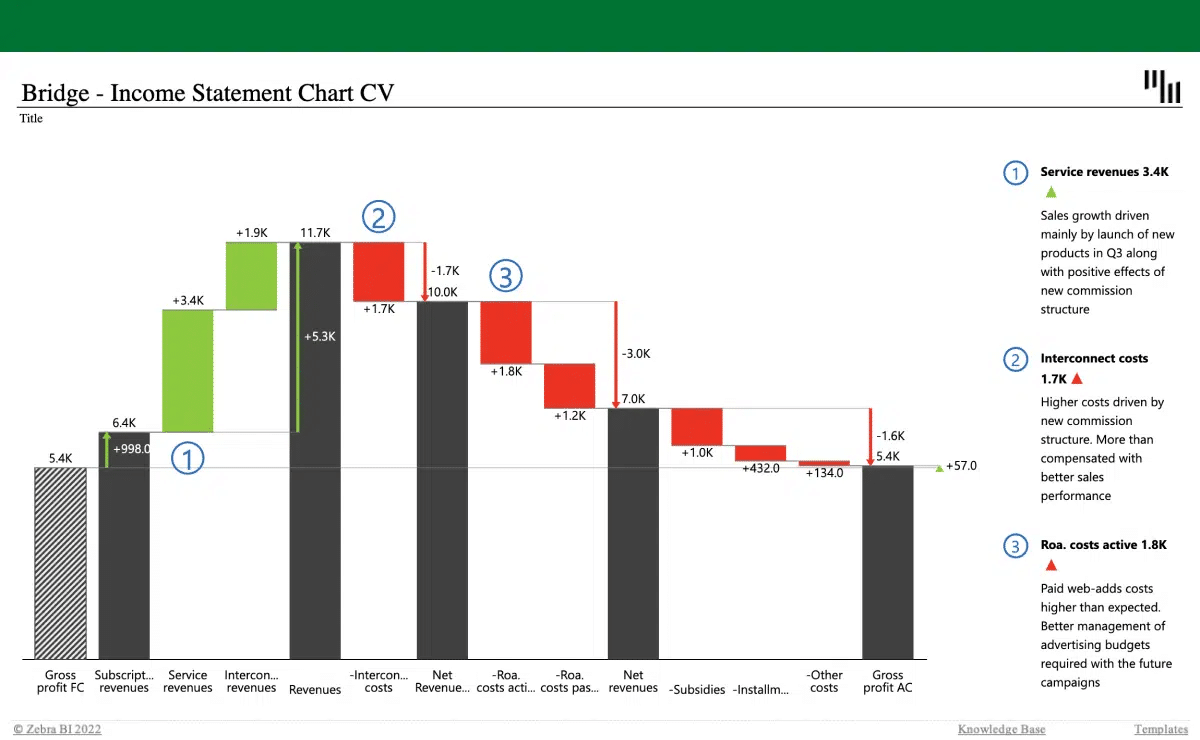
Our visuals automatically compute complex business metrics, including variances, and apply formatting and scaling in line with best practices and IBCS standards.
This ensures that your reports are not only faster to produce but also clear, consistent, and easy to understand.
Simplify your data models and accelerate report creation while ensuring flexibility and easy maintenance.
With Zebra BI, reporting is not just faster, but smarter.
Having standards in place is crucial for the same interpretation and understanding. And business reporting is not an exception here.
Following IBCS in your business reporting will help you achieve consistency and clarity. As a result, everyone in your company will understand the reports immediately and easily saving precious time and money.
Take a closer look at the key concepts of IBCS and put them into practice with Zebra BI.
By shifting from static to interactive reports, Zebra BI ensures users can independently explore data, pinpoint crucial performance indicators, and uncover insights.
With Zebra BI, you're not just interacting with data—you're engaging with it on a deeper level through advanced on visual settings, sophisticated formatting, and precise calculations.
This level of autonomy reduces dependency on report creators and speeds up decision-making processes.
Engage deeply with your data, improve your understanding, and drive meaningful business actions with Zebra BI’s interactive reports.
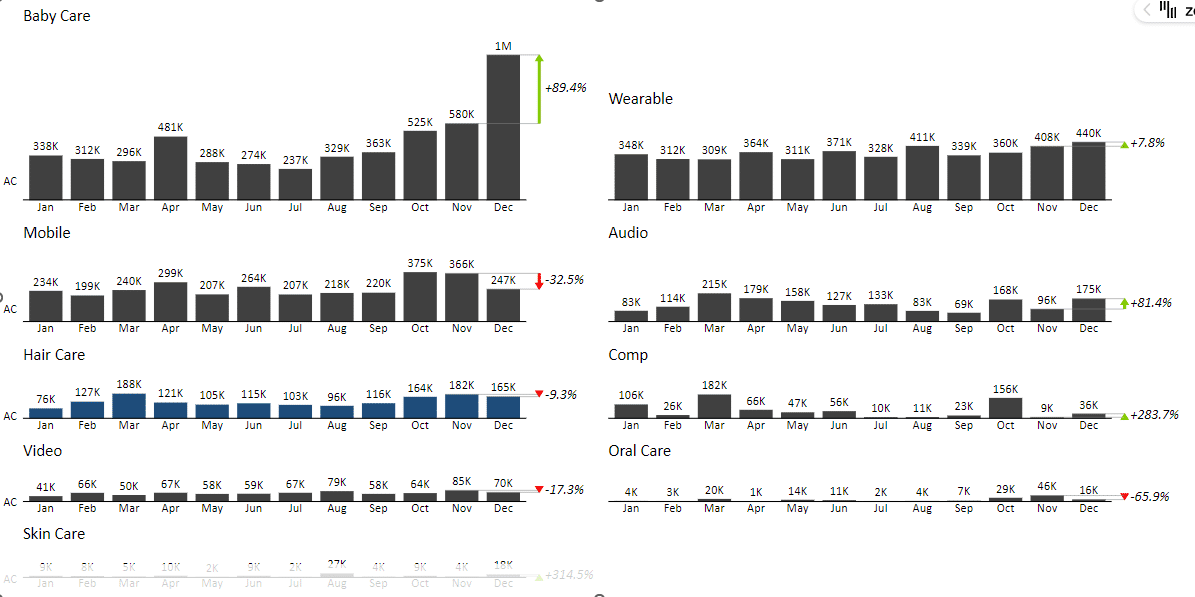
Zebra BI visuals for PowerPoint are the world's first fully responsive visualizations.
The visuals will automatically adapt the amount of information presented to fit the available space.