Category: Data Visualization

March 21, 2024
Data Visualization Trends 2025: Don't Get Left Behind – Discover What's Next
Explore 2024's data visualization trends for better business insights, integrating AI, interactive reports, and cross-platform collaboration.
PowerPoint
March 16, 2024
How to Prepare Financial Statements in PowerPoint
Follow our step-by-step guide to create professional and visually appealing financial statements in PowerPoint.
March 15, 2024
How to Perform Pricing Analysis in Excel
Learn how to perform pricing analysis in Excel with our comprehensive guide.
March 14, 2024
Understanding Business Insights: The Ultimate KPI Cheat Sheet
Learn how to understand business performance metrics across industries with Zebra BI's Ultimate KPI Cheat Sheet.
December 19, 2023
7 Best Practice Tips for Presenting Financials to the Business
In this collaboration between the FP&A Guy and Zebra BI learn the 7 best practice tips for presenting financials to the business.
December 4, 2023
The Future of Data Storytelling: Actionable Intelligence [AI, Power BI, and Office]
Learn about Actionable Intelligence and its role in data storytelling. AI is the future, but Power BI and Office are here to stay.
November 29, 2023
Leila Gharani x Zebra BI: How To Design A Perfect Excel Dashboard From Scratch
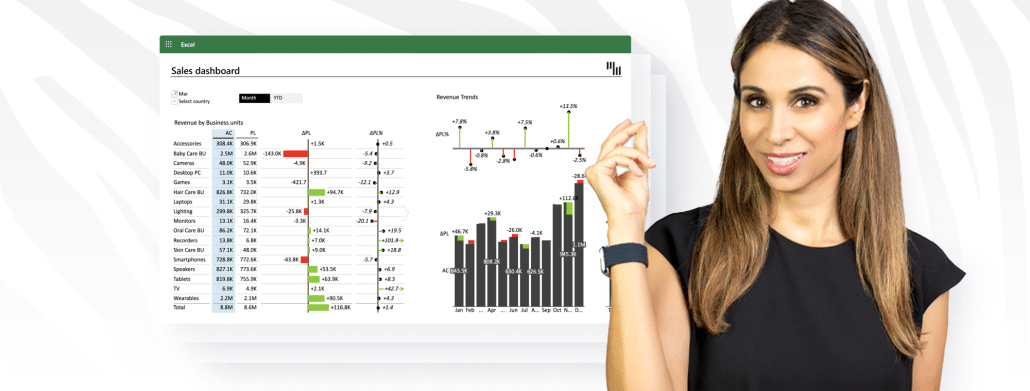
Discover key tips for Excel dashboard creation with Leila Gharani's tutorial and enhance your skills using Zebra BI's advanced tools for optimal analysis.
September 6, 2023
Zebra BI Tables: The Best Matrix & Table Visual on The Market in 2024
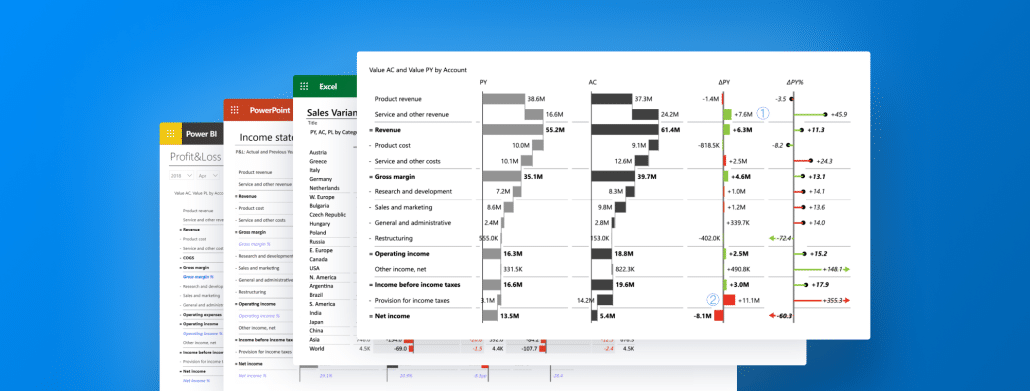
Explore Zebra BI Tables for efficient report space, clear visuals, and easy use. Ideal for modern business challenges with advanced visuals and IBCS compliance.
August 24, 2023
The Ultimate 2024 Bar Chart Guide
Uncover the process of crafting effective bar charts. Dive deep into Excel and Zebra BI's rich capabilities for a superior data presentation.

Pagination