🔥 Don’t miss the best offers of the year!
Get VIP Access Now

Category: Data Visualization

May 11, 2020
Impact of COVID-19 on the global stock markets – Live Data
We built an interactive dashboard that shows the unprecedented stock market volatility of the world’s top 200 companies during the COVID-19 pandemic.
April 11, 2019
The Best Power BI Visuals (Built-in and Custom) for Actionable Reports and Dashboards
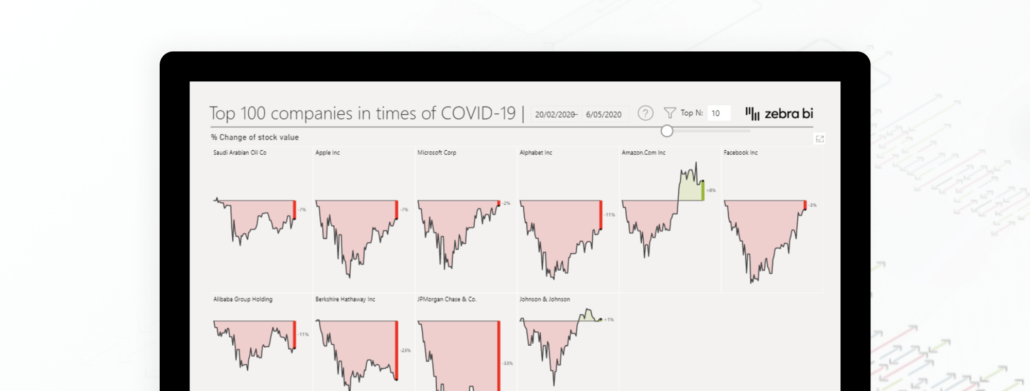
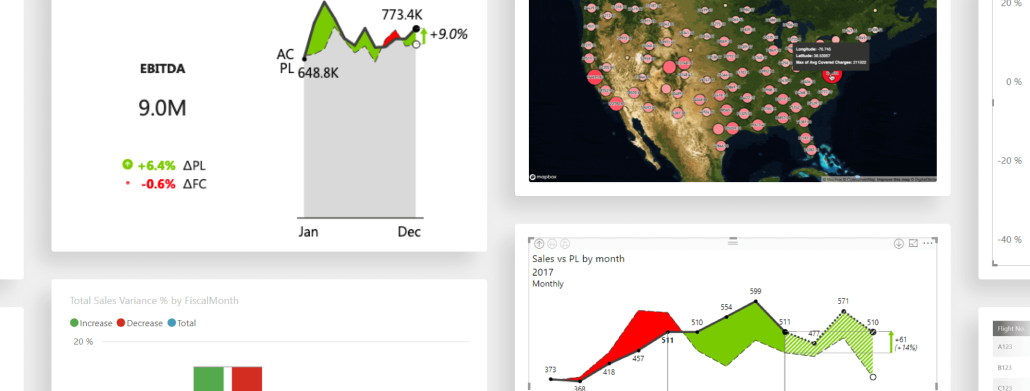
It has never been this easy to visualize and tell stories with your data. We'll focus on some built-in and custom visuals to make your reports more actionable.
February 20, 2019
Burning Questions: How to Add a Monthly/YTD Switch to a Power BI Dashboard?
Learn how to create a switch in Power BI dashboard that allows you to switch between Monthly and YTD views by using Data Analysis Expressions (DAX).
February 12, 2019
Top 5 New Productivity Features in Zebra BI Custom Visuals for Power BI
The latest version of Zebra BI for Power BI brings a bunch of new features that bring new flexibility to standardized reports.
January 7, 2019
7 things that you can do in Zebra BI visuals that are hard to do in Power BI
Power BI is a powerful tool for analyzing and visualizing data, but it falls short in some areas. Find out how Zebra BI visuals can make your life easier.
July 30, 2018
Microsoft income statement - FY18 Q4 financial results in Power BI
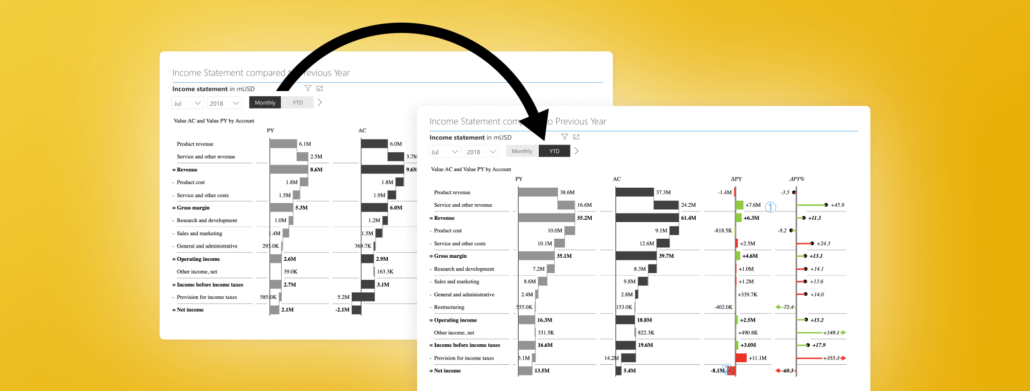
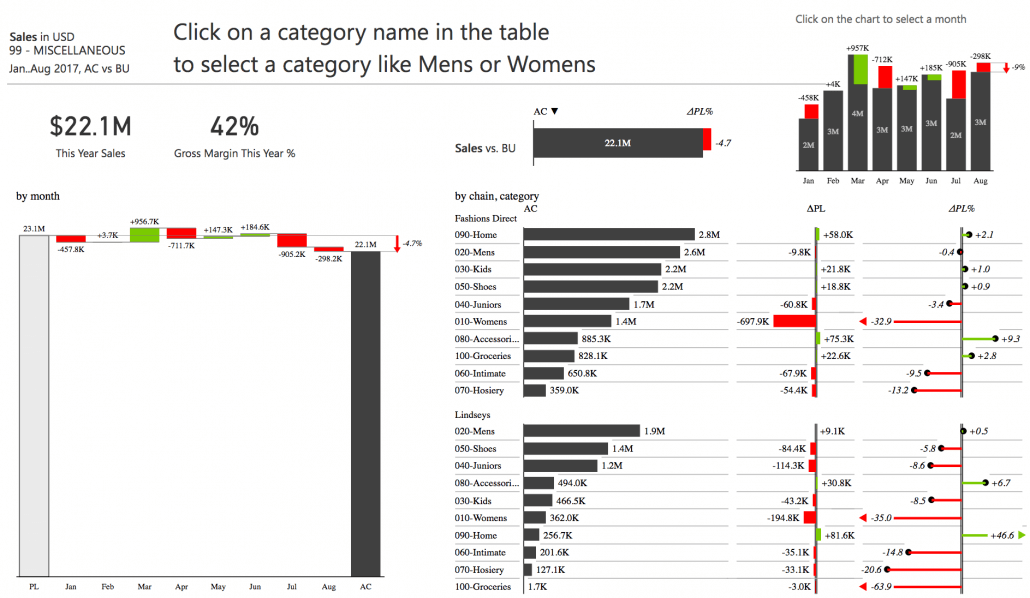
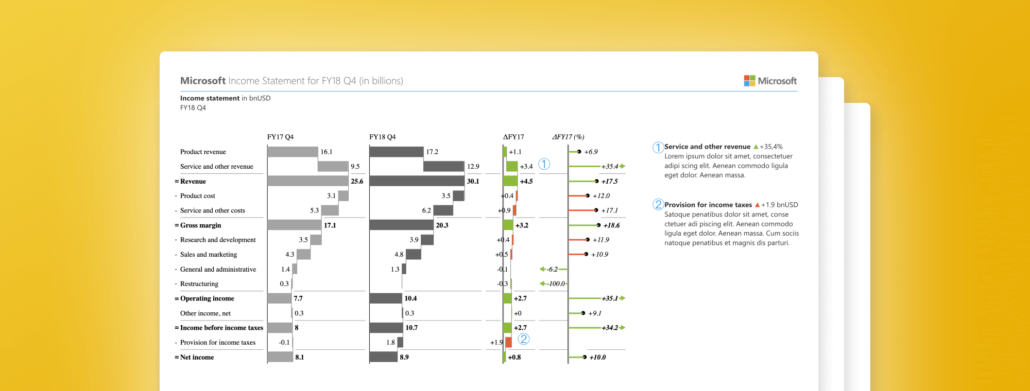
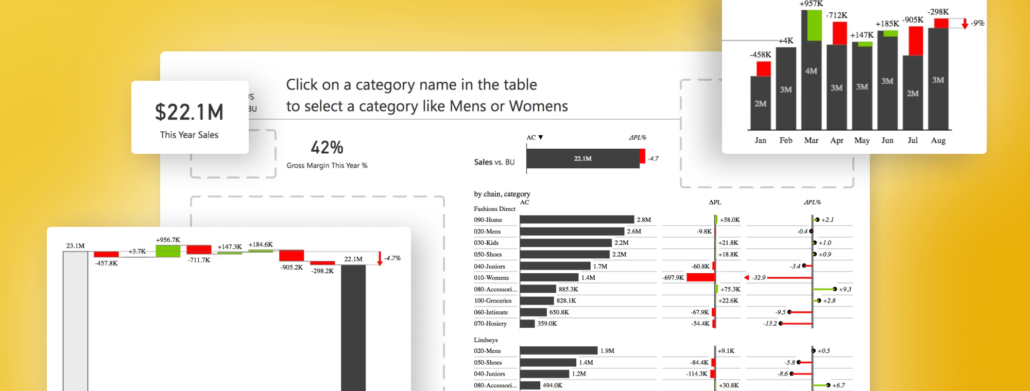
See an example of using Power BI capabilities with the advanced visualization capabilities of Zebra BI used for redesigning Microsoft's income statement.
June 1, 2018
Build Spectacular Power BI Dashboards using Zebra BI custom visuals
Get to knowall of the features that Zebra BI offers and how they contribute to better reporting experience in Power BI.
March 1, 2018
How to Design Income Statements in Excel
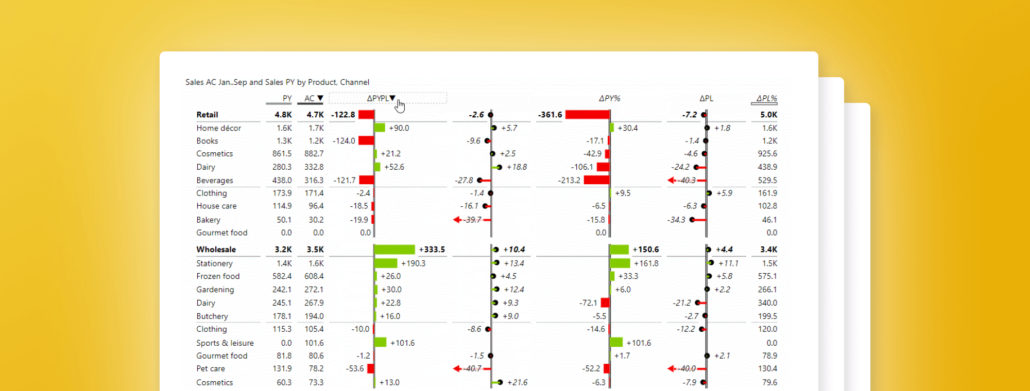
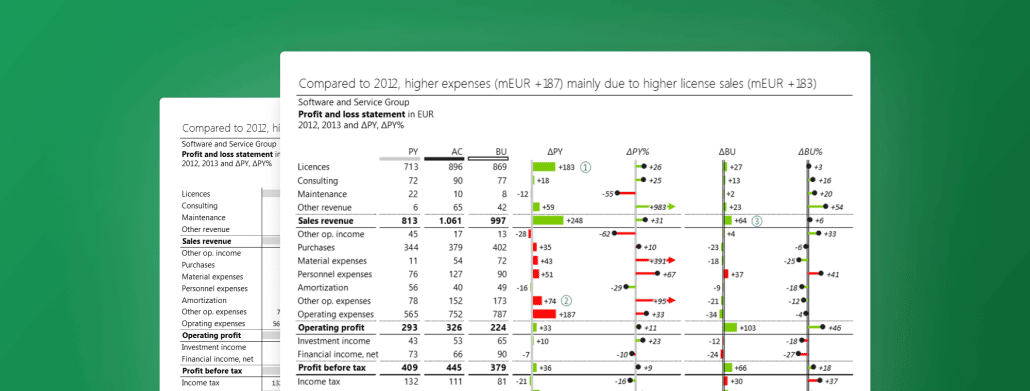
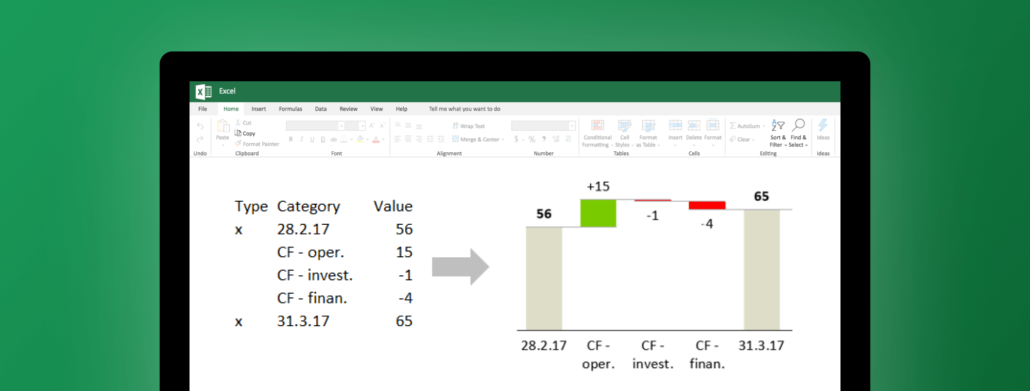
If there is one report that's a business constant, it's the income (profit & loss) statement. Learn how to create an actionable income statement in Excel
June 30, 2017
A different way to present cash flow statement
This is a guest post by Saša Butina, a consultant at SASH reporting. See more about SASH reporting at the end of the post.

Pagination