🔥 Don’t miss the best offers of the year!
Get VIP Access Now

Category: Data Visualization

June 21, 2017
Excel Waterfall Chart 101: How to create the best one for your needs
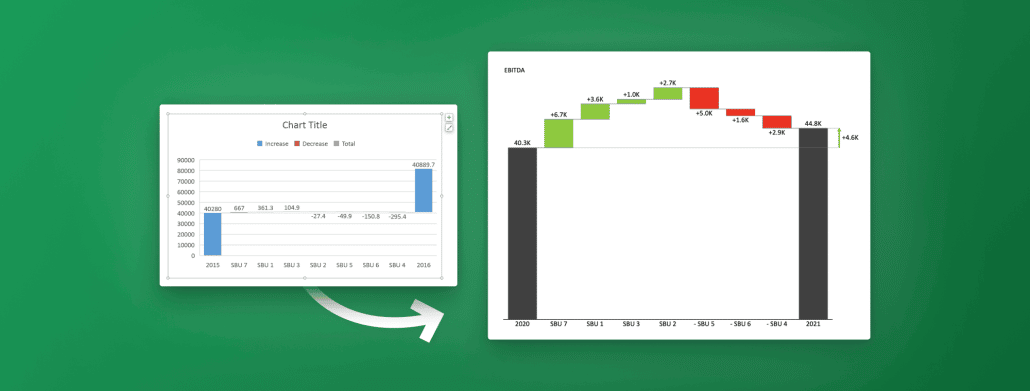
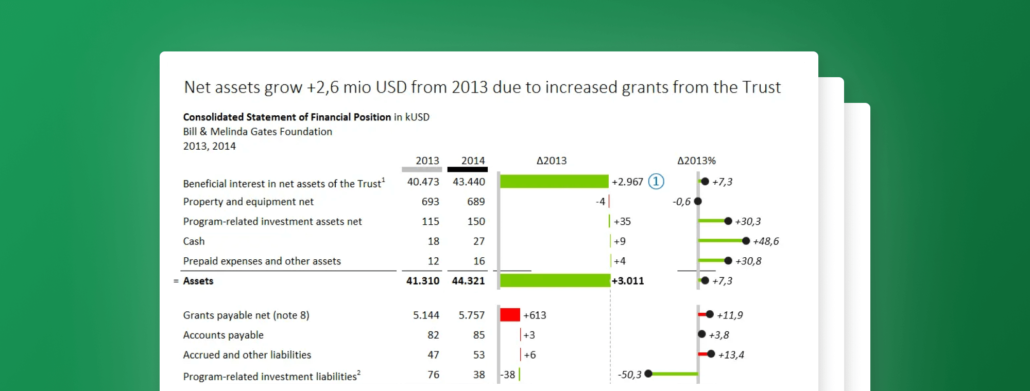
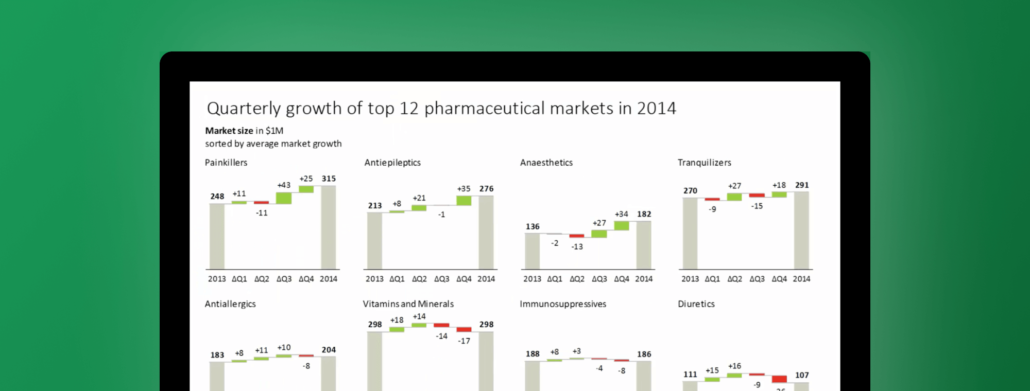
Learn how to create a visually appealing waterfall chart in Excel with our step-by-step guide. From beginners to experienced users, our guide provides all the necessary tips and tricks to impress your audience.
September 17, 2016
Trump's Chances - Redesign of The New York Times's Infografic
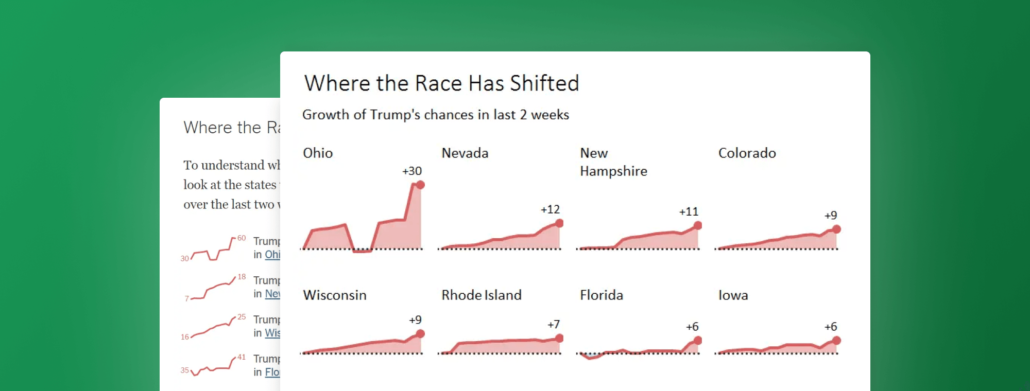
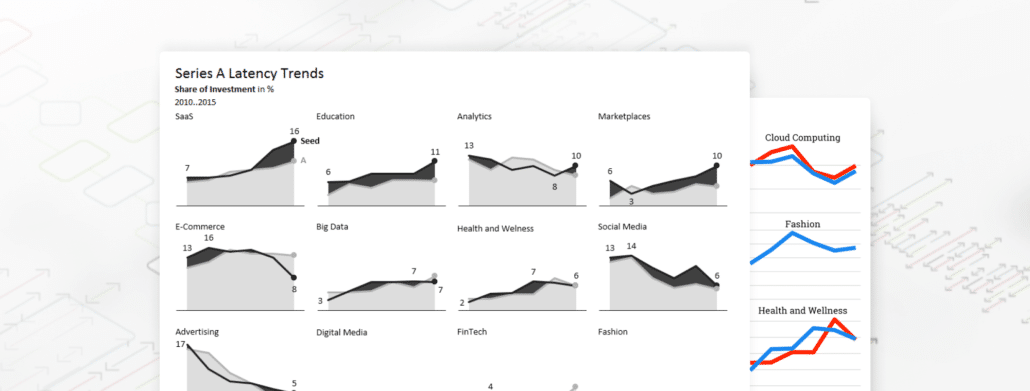
This visualization fails to convey a proper picture of the trends due to inconsistent scaling of charts. Learn 3 alternative solutions how to adress this problem.
March 24, 2016
Top 3 Ways to Report your Variance Analysis in Excel
There are a couple of different ways to perform variance analysis. Learn how to easily do it in Excel in 3 ways and improve your reporting.
March 23, 2016
8 Steps to Creating an Efficient Variance Report
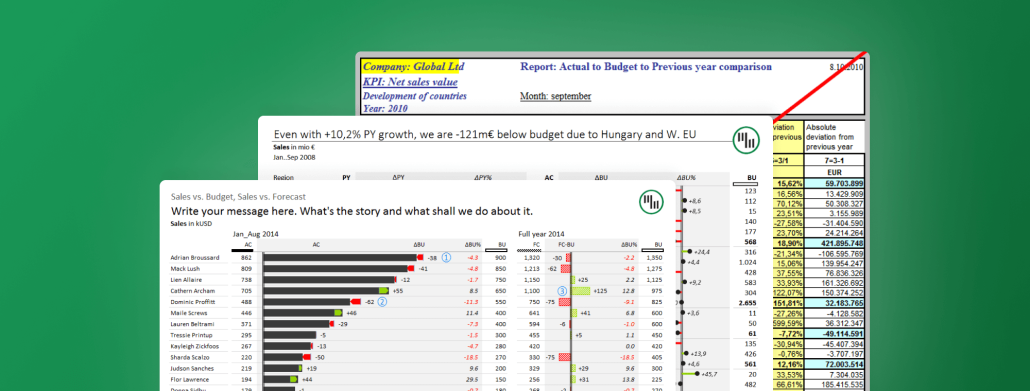
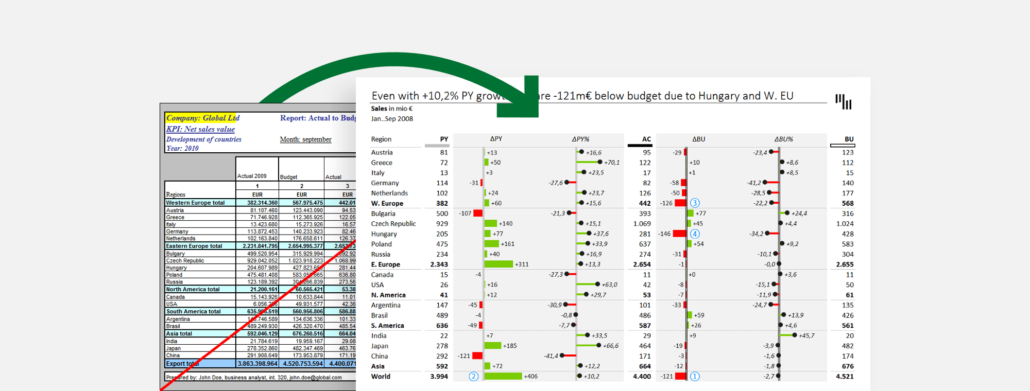
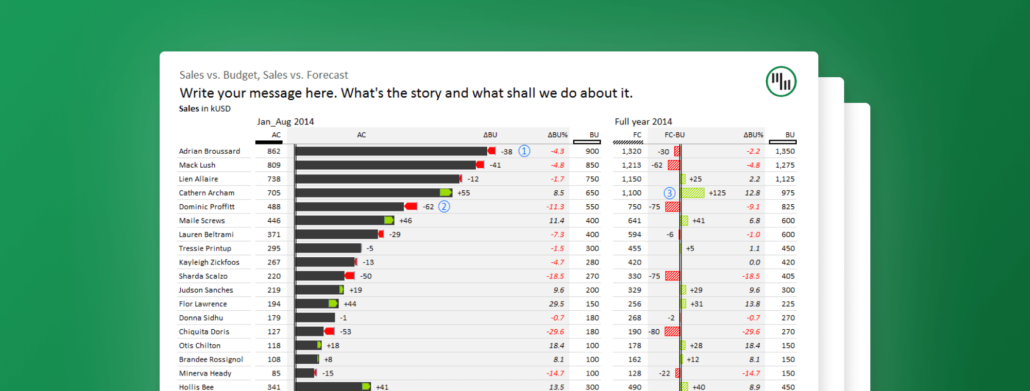
The internet is full of bad examples of variance reports. Follow this guide to see how we turn one such example into a great and efficient variance report.
March 3, 2016
Struggling to visualize your data? Zebra BI's got you covered!
Whether it’s waterfall charts, variance charts, or lollipop charts, Zebra BI has everything you need to visualize your data for all to understand.
February 5, 2016
The fastest way to insert lollipop charts in Excel
Lollipop charts can be used in similar situations as bar charts and column charts, but they have the advantage of producing a cleaner-looking picture.
January 19, 2016
Designing Financial Statements for Non-Profits & Foundations - The Gates Foundation example
This time we'll take a deep dive into the 2014 annual report of Bill & Melinda Gates Foundation. Check how we redesigned their financial statement.
January 12, 2016
How to visualize trends for multiple markets, products, etc.
Recently, my attention was drawn to an interesting analysis of The Hottest Startup Sectors In 2016. See how we analyzed and redesigned the data.
October 9, 2015
Making small multiples in Excel
Everything is possible in Excel, but some things just take forever. Find out how Zebra BI can help you create small multiples in just 1 click!

Pagination