Zebra BI Visuals are #1 Reviewed Add-In For Financial and Sales Dashboards.
4.9
Hear it from established data experts who are part of the 1.5 million Zebra BI customers from 3000 different companies.
Verified customer
“This tool is unique. Most tools only show us WHAT happened. Zebra BI answers WHY it happened.”
Gabriel Medina
Analyst at GxSoft Argentina
Verified customer
“Our controllers now spend less time preparing comprehensive reports and more time analyzing data and crystallizing the message.”
Alejandro Meyer
Planning & Controlling Director at SanLucar Fruit
Verified customer
“This a highly professional product. Our company’s leadership (finance and operations) is already asking we roll this out to all our PBI financial reports.”
Joe Pawlowski
Innovation Manager - Business Intelligence, DHL
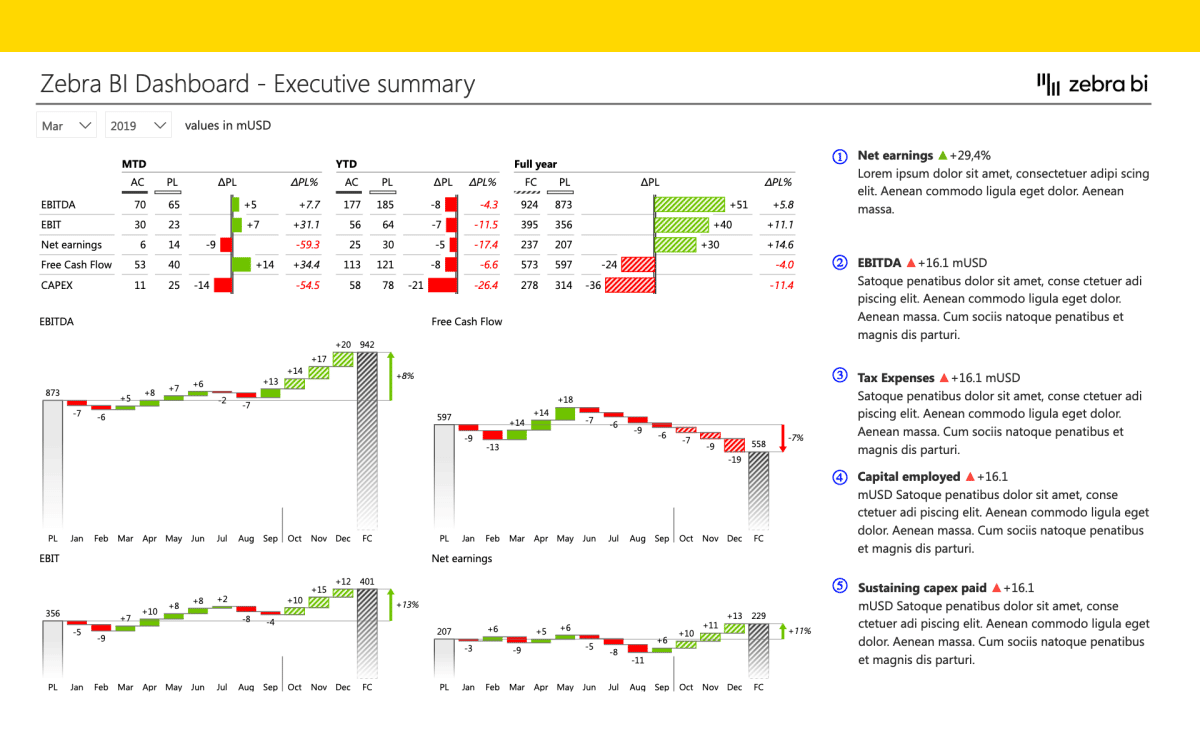
Unlock the power of data visualization
Use Zebra BI to simplify your work while upgrading your Power BI reports
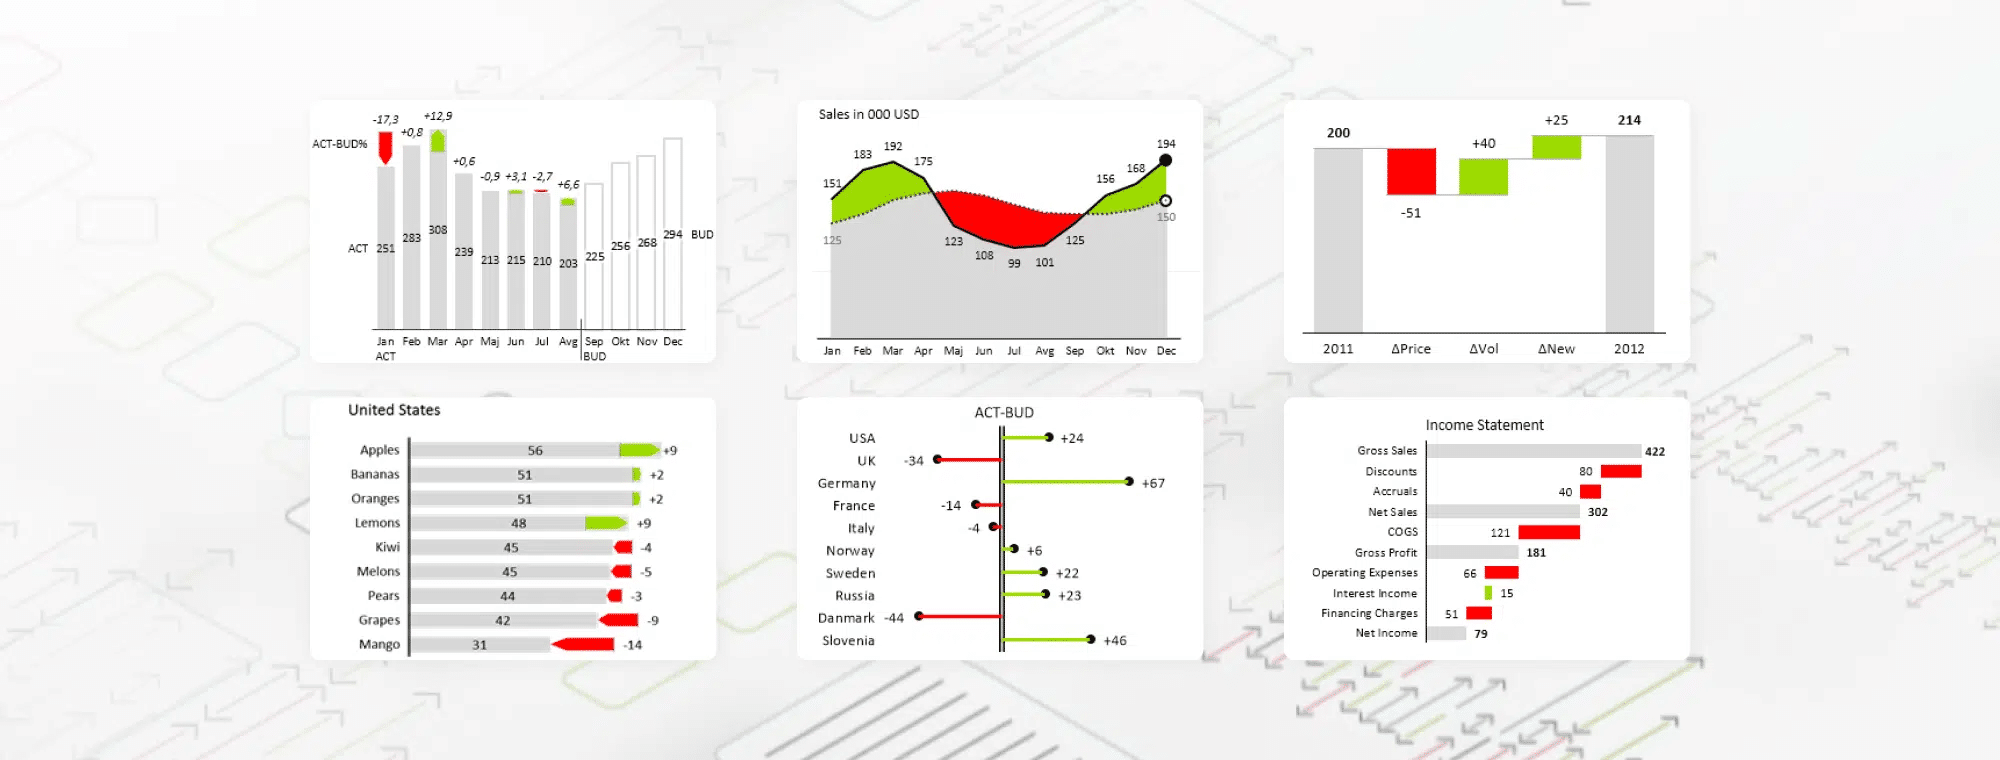
Create advanced reports in a single visual
Calculate comparisons out-of-the-box
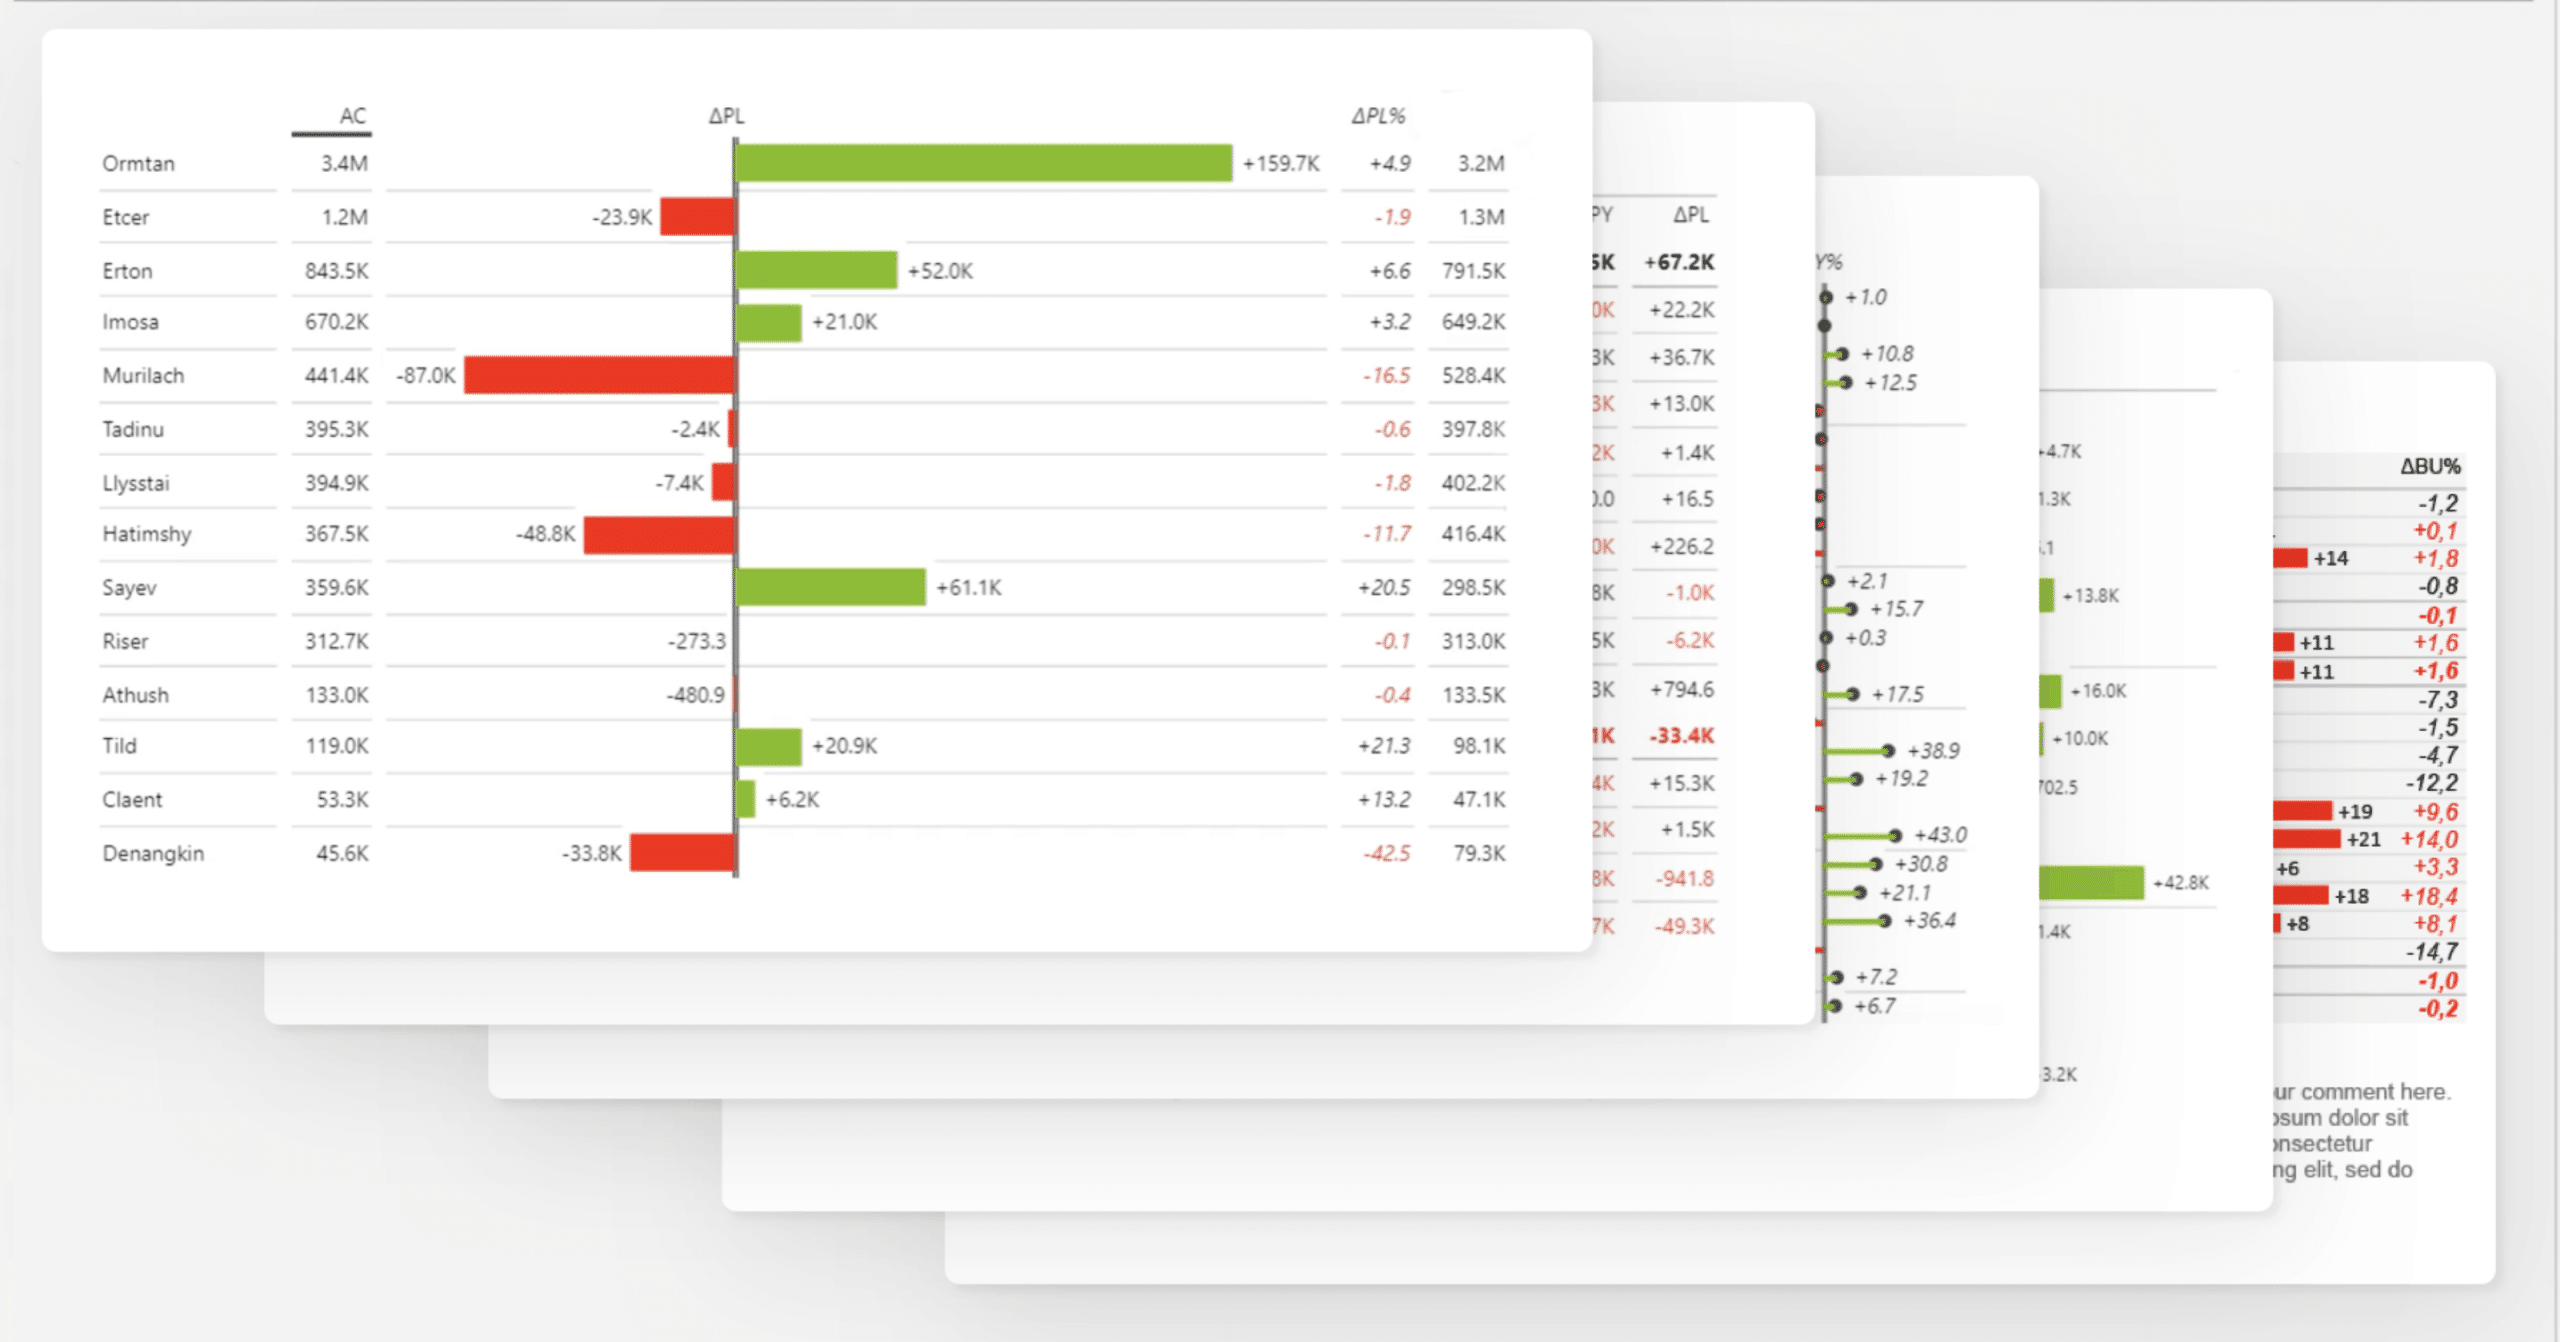
Adapt information density with responsive layout
Supercharge reports with advanced Small Multiples
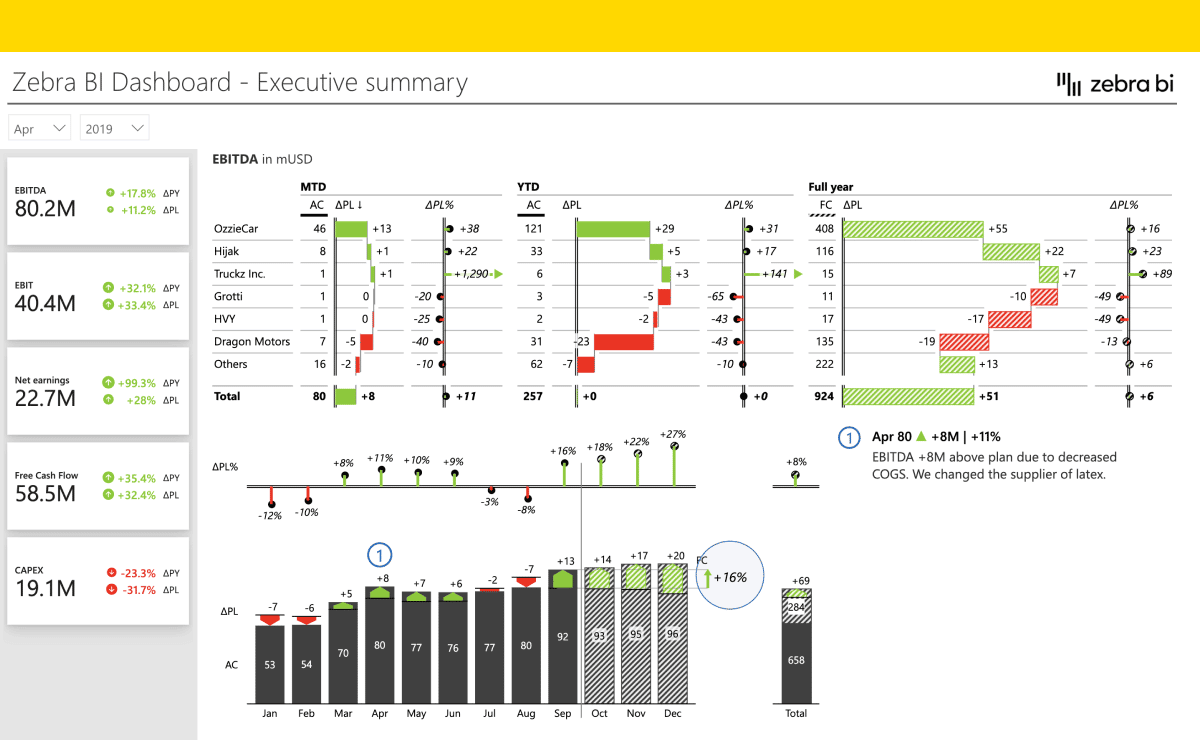
Add multiple KPIs within one visual
Integrate comments for better storytelling
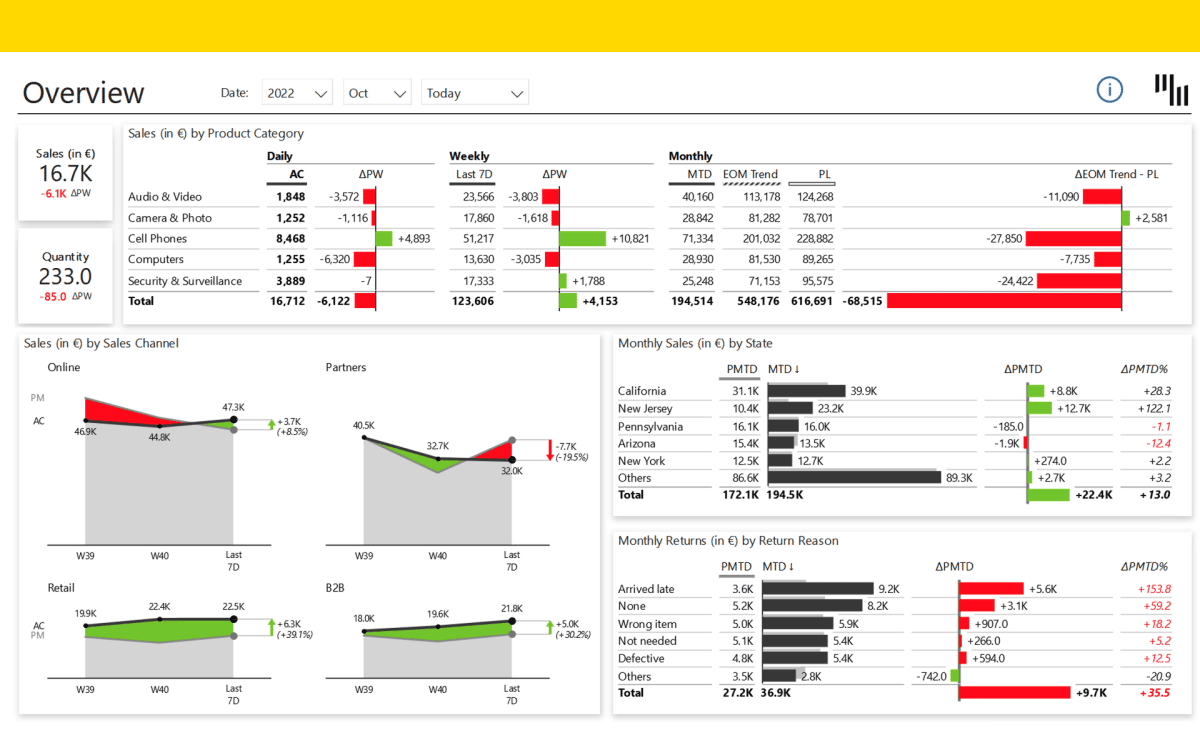
Zebra BI offers you an array of additional functions and options to upgrade your Power BI reports.
Choose between our customizable business report templates
Explore Zebra BI in Power BI for free and create reports that will have the right information for everyone. You can also contact us to help you build your first test report or create a custom offer for your business.
 September 8th
 February 22nd