How to Calculate Ratio in Excel
Excel is one of the most widely used spreadsheet programs in the world, and for good reason. It offers many powerful features that make data analysis a breeze, and one of those features is the ability to calculate ratios. Ratios are an important tool for analyzing data, and in this article, we will take a deep dive into how to calculate ratios in Excel.
Understanding the Importance of Ratios in Excel
Before we calculate ratios in Excel, let's understand why they are so important. Ratios compare different aspects of a business or operation, providing insights into its financial health and overall performance. For example, a company might use ratios to measure profitability, liquidity, or efficiency.
Furthermore, ratios can also be used to compare a business to its competitors or industry benchmarks. This allows companies to identify areas where they may be falling behind or excelling compared to others in their field. By understanding these ratios, businesses can make informed decisions about where to allocate resources and how to improve their operations.
The Basics of Ratio Calculation in Excel
The basic formula for calculating a ratio is to divide one number by another. For example, if you want to calculate the ratio of profit to revenue, you would divide the profit by the revenue. To do this in Excel, you can type in the formula: =profit/revenue. Excel will then calculate the ratio and display the result in the cell.
It is important to note that ratios can also be expressed as percentages. To convert a ratio to a percentage, you simply multiply the ratio by 100. For instance, if the profit-to-revenue ratio is 0.25, you can convert it to a percentage by multiplying it by 100, resulting in a percentage of 25%.
Furthermore, ratios can be used to compare different sets of data. For example, you can use ratios to compare the revenue of two different companies or the sales of two different products. By calculating and comparing ratios, you can gain valuable insights into the performance of different aspects of your business.
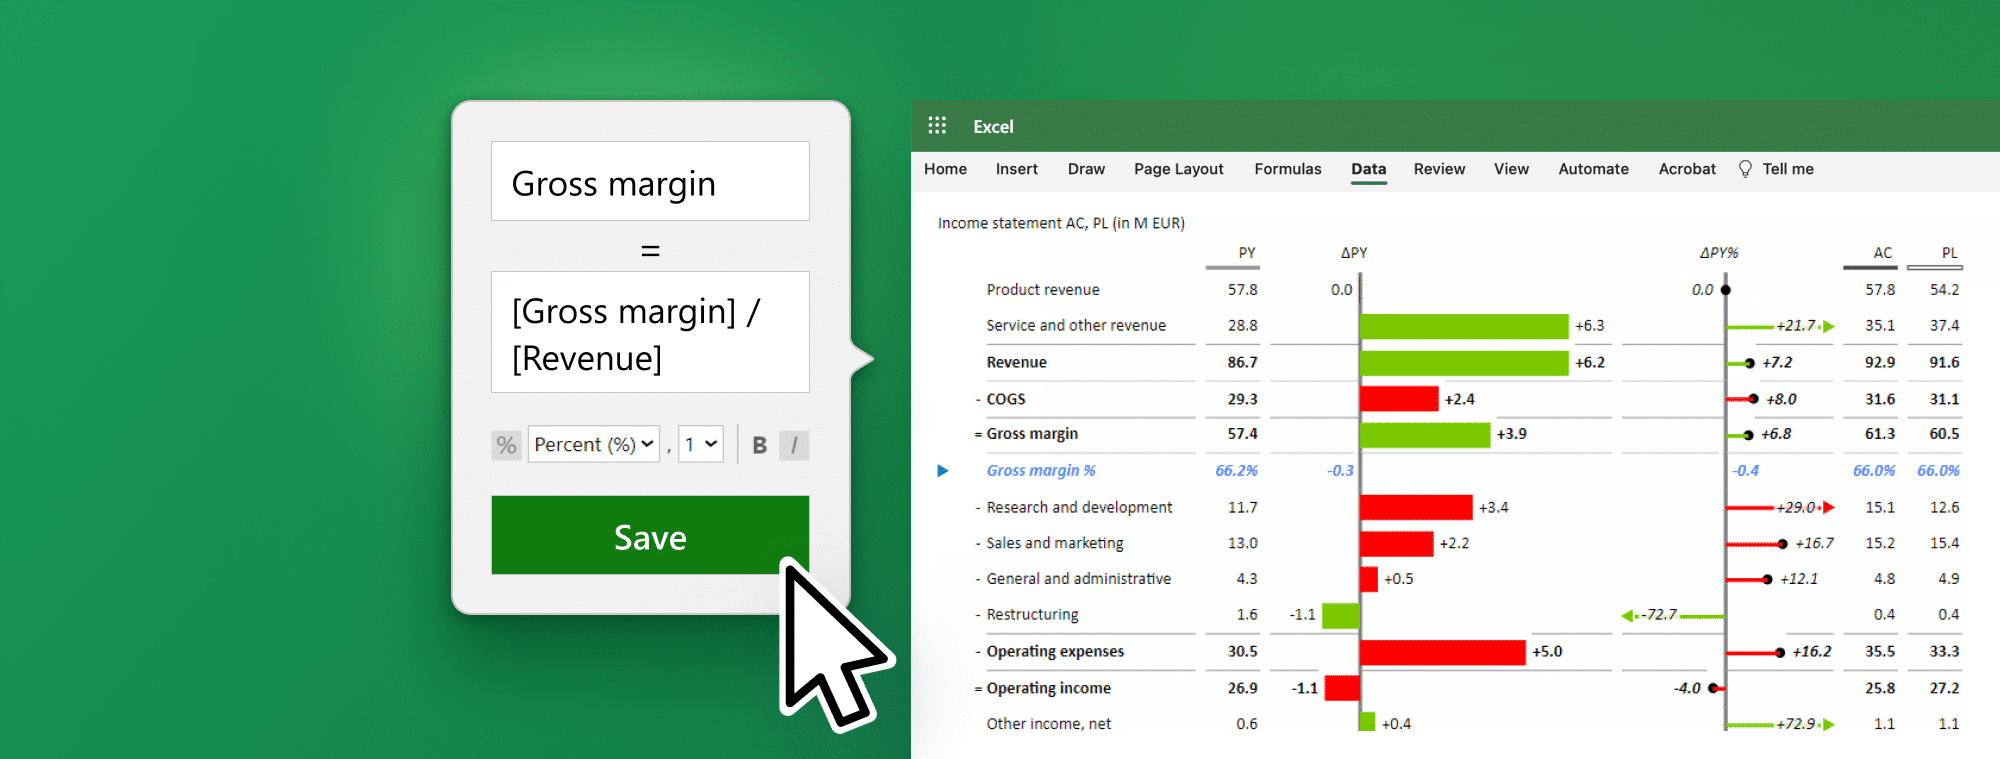
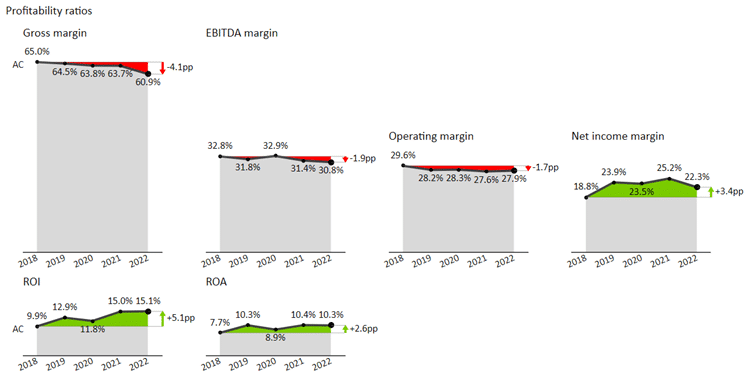
In Zebra BI Tables, ratios can be calculated inside of the visual at the time as you are looking at your financials → Read how: Add Formula feature in Zebra BI for Office
Note: Gross margin, operating margin, and net income margin, which were not in the dataset but were calculated using Add Formula simply by referencing to accounts in the income statement.
Step-by-Step Guide to Calculating Ratios in Excel
Here is a step-by-step guide to calculating ratios in Excel:
- Identify the data points you want to use to calculate the ratio.
- Select the cell where you want to display the ratio.
- Type in the formula for the ratio using the appropriate cell references. For example, to calculate the debt-to-equity ratio, you would type in
=debt/equity. - Press enter, and Excel will calculate the ratio and display the result in the cell.
It is important to note that while Excel does not have specific functions named after common financial ratios like the current ratio or the quick ratio, you can still calculate these ratios by manually creating the formulas using the appropriate cell references.
In Zebra BI Tables for Office, you can add a custom formula with just a few clicks. Let’s add this one:
Gross Profit = Sales – COGS
Additionally, Excel allows you to create charts and graphs to represent your ratio calculations visually. This can be helpful in identifying trends and patterns in your data. To create a chart or graph, select the data points you want to include and click on the "Insert" tab. From there, you can choose the type of chart or graph you want to create and customize it to fit your needs.
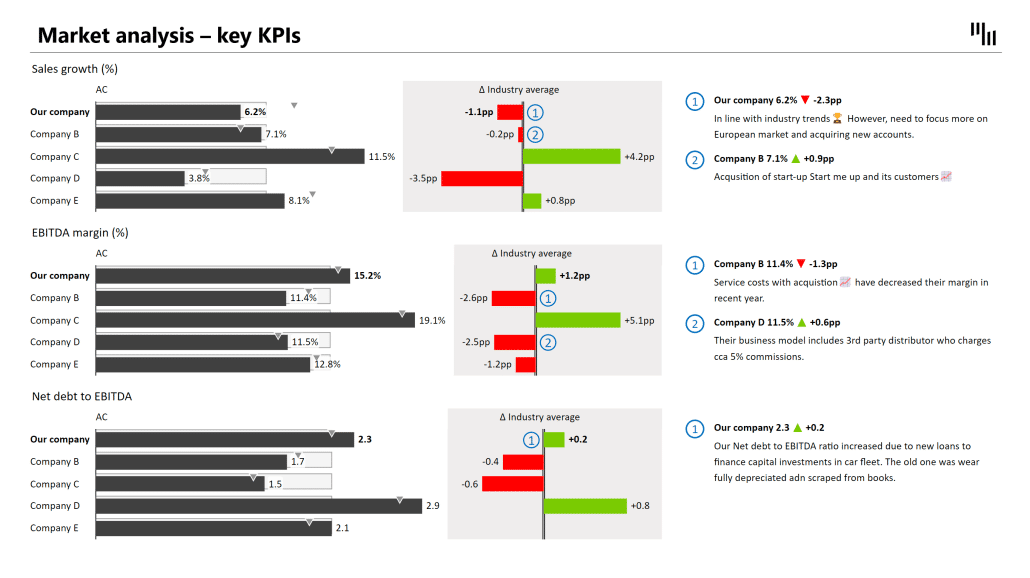
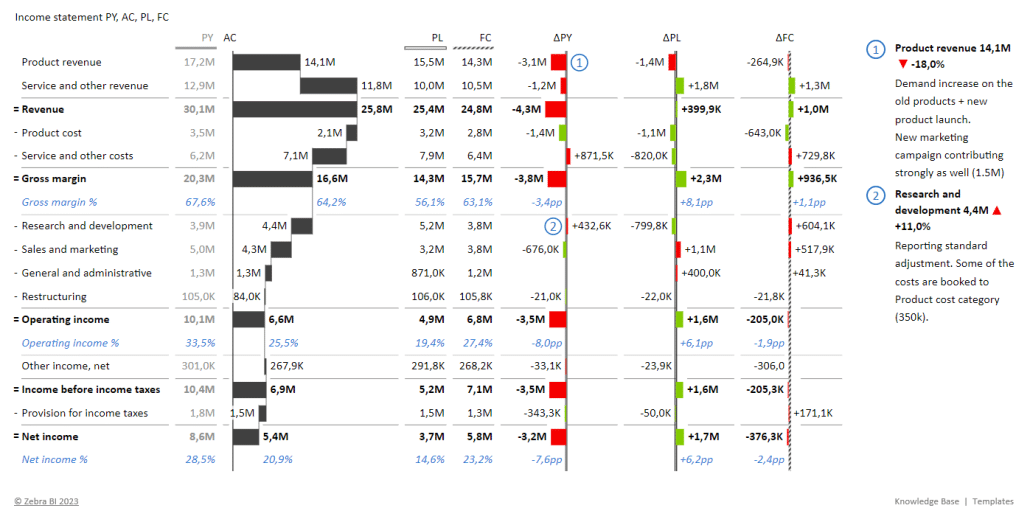
Zebra BI Charts are the perfect tool for visualizing ratio trends. They follow the best practices outlined in IBCS standards to ensure clear and meaningful insights from your data.
Using Formulas to Calculate Ratios in Excel
Unfortunately, Excel does not have built-in formulas for calculating ratios, but it allows you to create custom formulas for ratios that may not be included in the built-in formulas. This can be done by using a combination of mathematical operators and cell references. Custom formulas can be saved and reused for future calculations, saving time and effort.
Download Zebra BI's Financial Statements Cheat Sheet and have all the formulas at hand!
It is important to note that when using formulas to calculate ratios in Excel, you must ensure that the data you are using is accurate and up-to-date. If the data is incorrect, the ratios calculated will also be incorrect, which can lead to poor decision-making.
How to Calculate Simple Ratios in Excel
Calculating simple ratios in Excel is straightforward. A simple ratio involves comparing two numbers, such as profit and revenue. To calculate a simple ratio in Excel, divide one number by the other using the formula =number1/number2. For example, to calculate the profit margin, you would divide the profit by the revenue.
It is important to note that when calculating ratios in Excel, you should format the cell as a percentage to make it easier to read. To do this, select the cell with the ratio, right-click, and choose "Format Cells." Then, select "Percentage" under the "Number" tab.
How to Calculate Complex Ratios in Excel
Some ratios involve comparing multiple data points, such as the Altman Z-Score, which measures a company's financial health. Calculating complex ratios in Excel may require more complicated formulas or functions. However, Excel offers a wide range of tools and functions that make complex calculations much easier.
One of the most useful tools for calculating complex ratios in Excel is the Pivot Table. This tool allows you to quickly summarize and analyze large amounts of data, making it easier to identify trends and patterns. Additionally, Excel's built-in charting tools can help you visualize your data and communicate your findings to others.
For next-level data analysis and exploration, you should use Zebra BI visuals that can use a pivot table as a data source. However, the added value is in cross-visual filtering, which users usually use from Power BI.
Another important consideration when calculating complex ratios in Excel is data accuracy. It's important to ensure that your data is accurate and up-to-date, as even small errors can have a significant impact on your calculations. To help ensure data accuracy, consider using Excel's data validation tools, which can help you identify and correct errors in your data.
Tips and Tricks for Accurate Ratio Calculation in Excel
Here are a few tips and tricks to keep in mind when calculating ratios in Excel:
- Make sure your data is accurate and up-to-date.
- Use clear and consistent labels for your data points.
- Double-check your formulas and cell references for accuracy.
- Use Excel's built-in formatting tools to make your data more readable and easily understood.
Another important tip when calculating ratios in Excel is to choose the appropriate ratio formula for your specific needs. There are various types of ratios, such as liquidity ratios, profitability ratios, and efficiency ratios, each with its own unique formula. Make sure to research and select the correct formula for the ratio you are trying to calculate.
Additionally, it can be helpful to use Excel's data validation feature to ensure that your data is entered correctly and consistently. This feature allows you to set specific criteria for the data entered into a cell, such as a range of acceptable values or a specific format. This can help prevent errors and ensure that your data is accurate and reliable.
Using Conditional Formatting for Ratio Analysis in Excel
Conditional formatting is a powerful tool in Excel that allows you to apply formatting to cells based on certain criteria. This can be useful when analyzing ratios, as you can highlight cells that fall outside of a predefined range. For example, you might use conditional formatting to highlight cells with a profit margin below a certain threshold.
Another way to use conditional formatting for ratio analysis is to create color scales that visually represent the magnitude of the ratio. For instance, you can use a color scale to show the relative size of profit margins across different products or time periods. This can help you quickly identify trends and outliers in your data.
How to Use Charts and Graphs for Ratio Analysis in Excel
Charts and graphs are a great way to visualize ratios and other data points in Excel. You can create a wide range of charts and graphs, from simple bar charts to more complex scatter plots. When creating a chart or graph for ratio analysis, it's important to choose the right type of chart for the data you are analyzing.
One important consideration when using charts and graphs for ratio analysis is to ensure that the data is accurate and up-to-date. This means that you should regularly update your data and double-check your calculations to avoid any errors that could skew your analysis. Additionally, it's important to consider the context in which the ratios are being analyzed, as this can affect the interpretation of the data.
Another useful tip when using charts and graphs for ratio analysis is to include a clear and concise title that accurately reflects the data being presented. This can help to ensure that your audience understands the purpose of the chart or graph and can easily interpret the information being presented. Additionally, you may want to consider including labels or annotations to provide additional context or highlight key data points.
Common Mistakes to Avoid While Calculating Ratios in Excel
Here are a few common mistakes to avoid when calculating ratios in Excel:
- Using incorrect formulas or cell references.
- Not double-checking your work for accuracy.
- Not using consistent labels for your data points.
- Not formatting your data for readability.
Another common mistake to avoid when calculating ratios in Excel is not considering the context of the data. It's important to understand the purpose of the ratio and how it will be used to make informed decisions. Additionally, not accounting for outliers or anomalies in the data can skew the results and lead to inaccurate ratios. Always review your data carefully and make adjustments as necessary to ensure the accuracy of your ratios.
Best Practices for Effective Ratio Calculation in Excel
Finally, here are a few best practices to keep in mind when calculating ratios in Excel:
- Start with a clear understanding of the ratios you want to calculate and why they are important.
- Use accurate and up-to-date data.
- Double-check your formulas and cell references for accuracy.
- Use Excel's built-in tools and functions to simplify complex calculations.
- Use clear and consistent labels for your data points.
- Format your data for readability and use conditional formatting and charts to visualize your data.
Calculating ratios in Excel can be a powerful tool for analyzing and understanding data. By following these tips and best practices, you can ensure that your ratio calculations are accurate, effective, and meaningful.