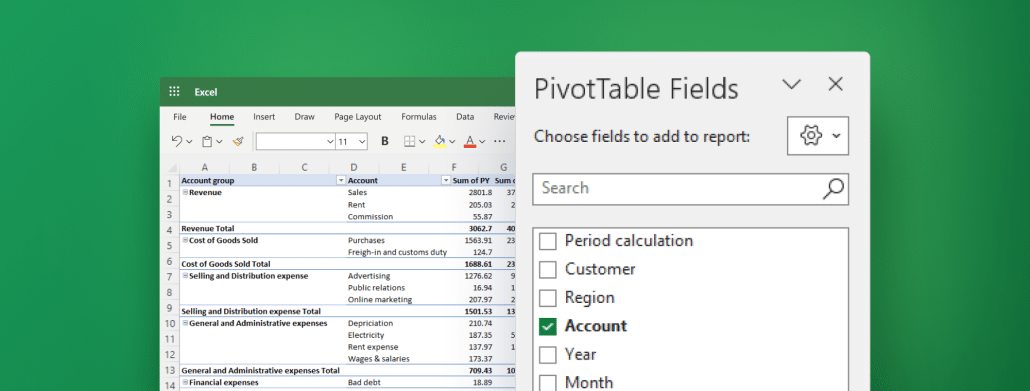
Pivot tables for financial analysis: your new Excel BFF! Uncover their power to turn complex data into crystal-clear insights. Click, learn, and conquer!
Enhance your financial reporting with a free cash flow statement from the pivot table template and gain comprehensive insights into your business's cash flow.
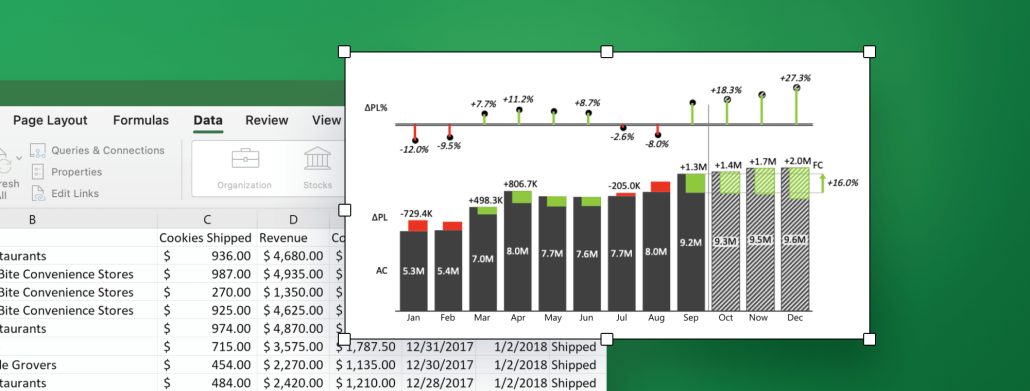
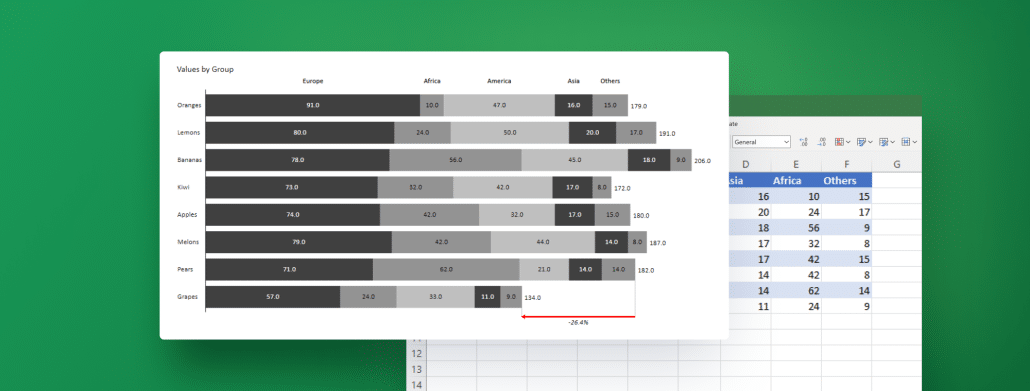
Stacked bar charts allow you to break down your data into segments, which provides your stakeholders with a comprehensive view of the information at hand. Learn how to create your best stacked bar chart in Excel with next-level features using Zebra BI for Office.
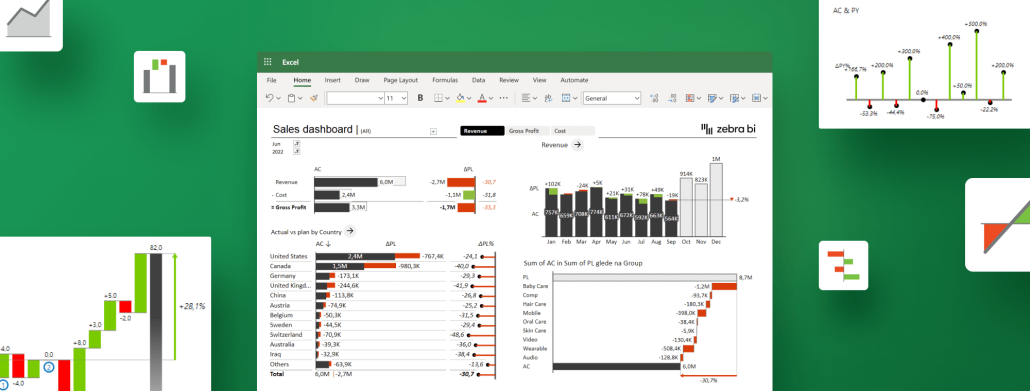
Learn the must-know tricks for creating compelling interactive Excel dashboards that deliver key business insights at a glance. Level up your reporting while saving yourself some precious time.
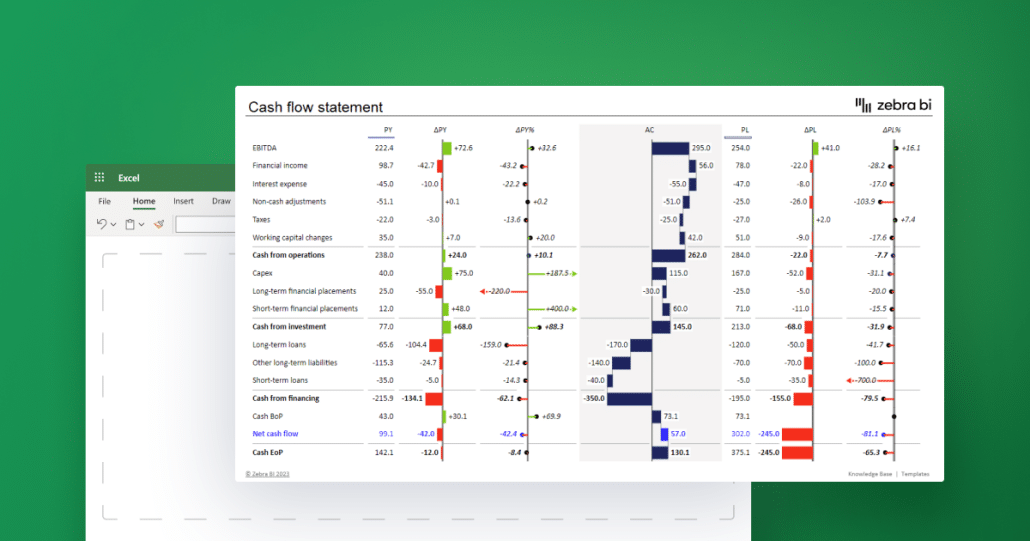
Learn how to create a powerful cash flow statement in Excel for your business. Track your cash inflows and outflows with accuracy and identify trends, risks, and opportunities.
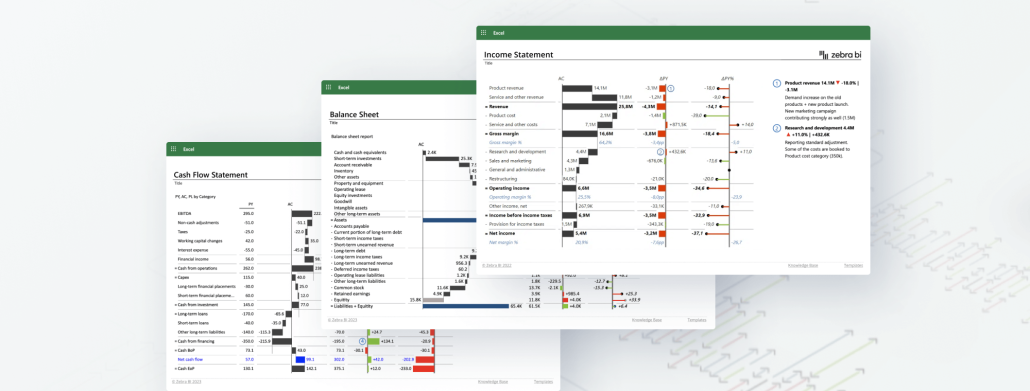
To gain insight into their financial health and progress, most companies need to prepare three essential reports – income statement, balance sheet and cash flow statement. Let's explore them one by one.
 September 8th
 February 22nd
 05 Mar 2026