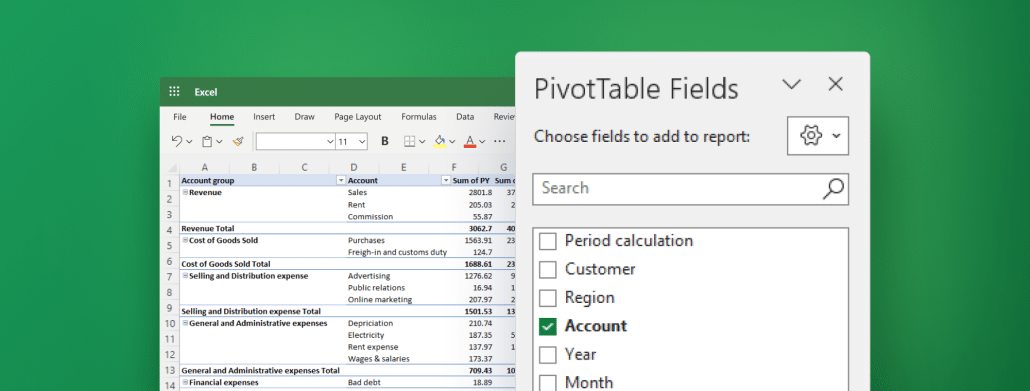
Pivot tables for financial analysis: your new Excel BFF! Uncover their power to turn complex data into crystal-clear insights. Click, learn, and conquer!
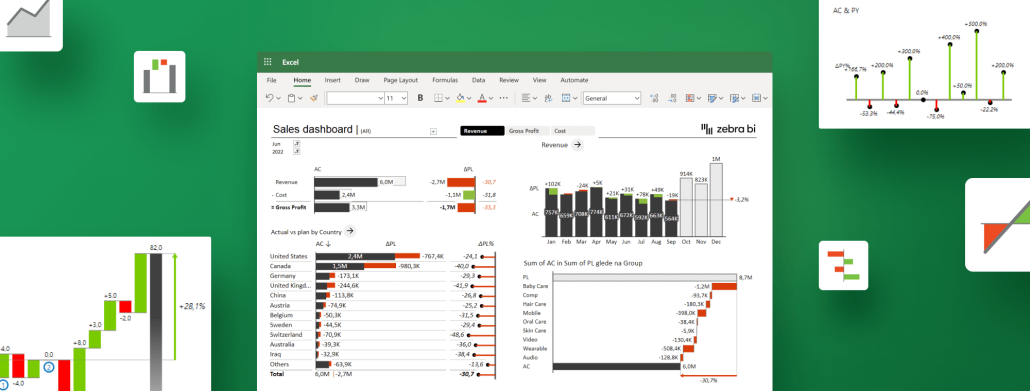
Learn the must-know tricks for creating compelling interactive Excel dashboards that deliver key business insights at a glance. Level up your reporting while saving yourself some precious time.
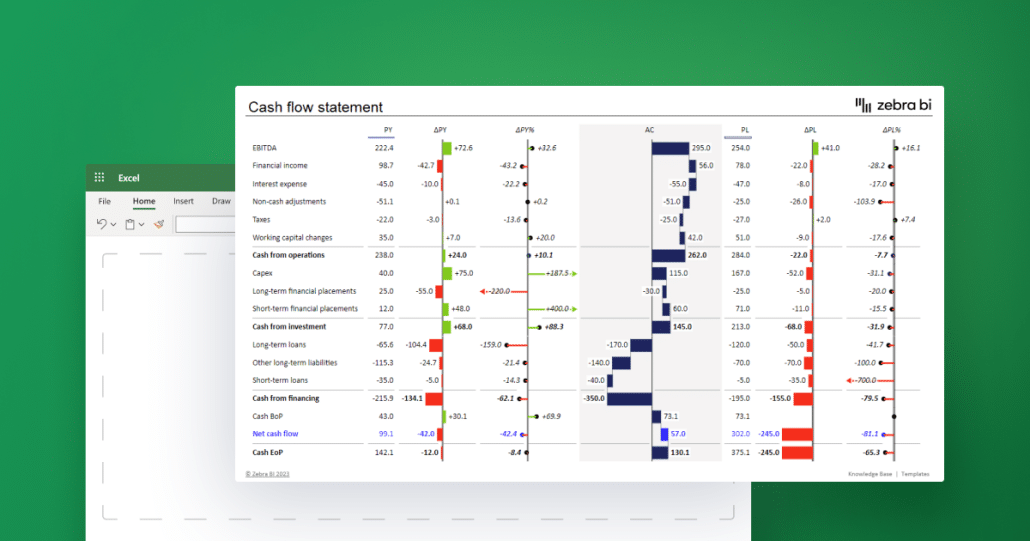
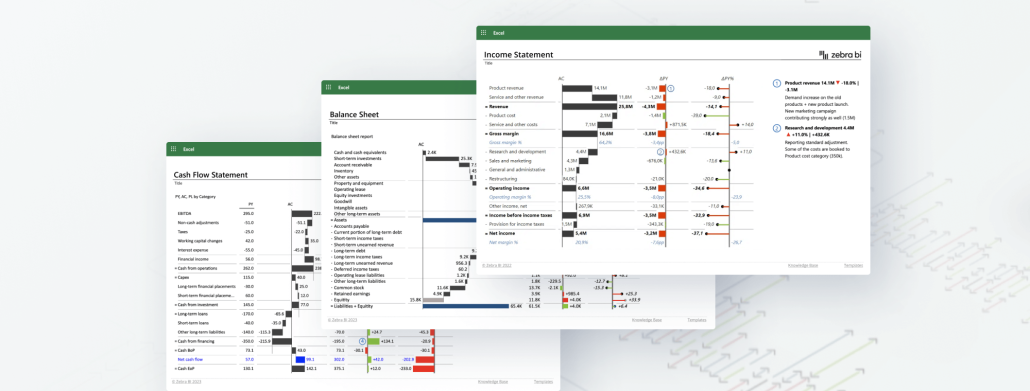
Learn how to create a powerful cash flow statement in Excel for your business. Track your cash inflows and outflows with accuracy and identify trends, risks, and opportunities.
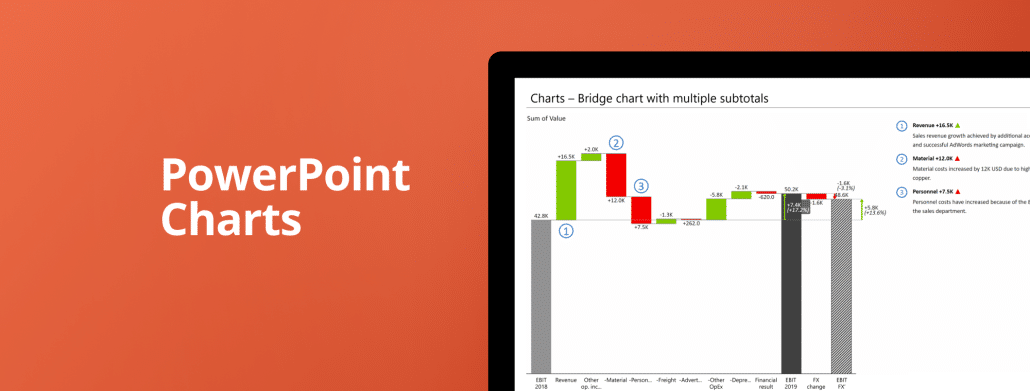
Learn how to create stunning interactive presentations with 30+ advanced PowerPoint charts and tables. All it takes is just seconds – see for yourself.
To gain insight into their financial health and progress, most companies need to prepare three essential reports – income statement, balance sheet and cash flow statement. Let's explore them one by one.
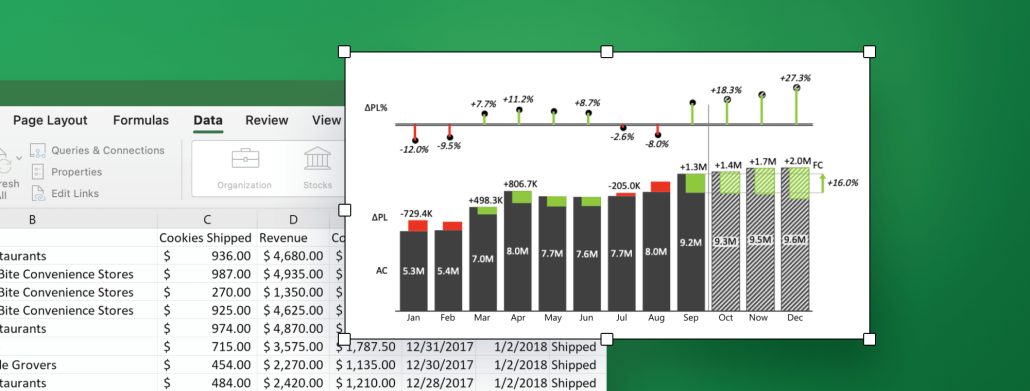
Visualize your sales performance with these easy-to-use templates for Excel. Compare your actuals with up to 3 measures (PY, PL and FC) and take advantage of advanced visualization features to show business insights in the clearest way possible.
 September 8th
 February 22nd