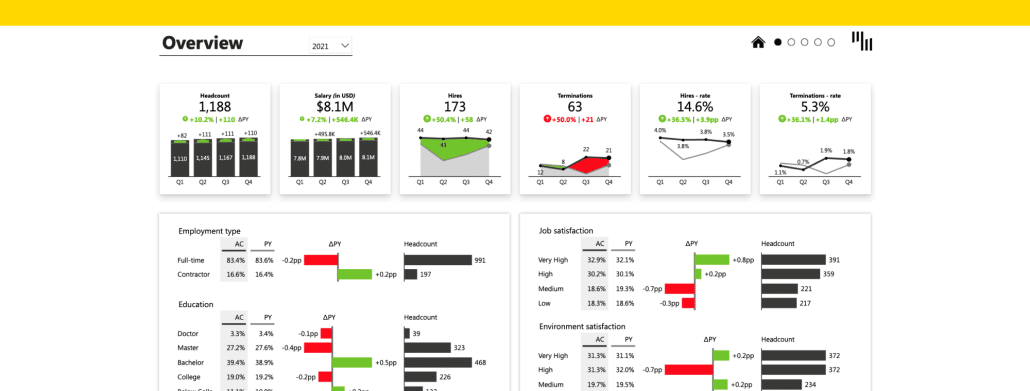
The Human Resources Power BI dashboard allows users to get a clear overview of the company's employees and the most relevant top-level KPIs: Headcount, Salaries, Hires and Terminations.
Slow reports are an issue most users struggle with when it comes to Power BI. What can you do about it? Register for this live session to speed up your reports and improve the experience for your end users NOW.
This Power BI template allows you to have a clear overview of the Current Assets, Current Liabilities and the difference between them. You can understand the balance sheet at a glance and analyze the trends of each KPI.
When it comes to working with time periods in Power BI, you should know your way around DAX functions and Power Query. Register to learn how to handle them and implement that immediately!
The Sales Funnel template for Power BI lets you display your most important KPIs on one page. Simply, track your conversations, understand your sales performance and how your pipeline is looking at all times.