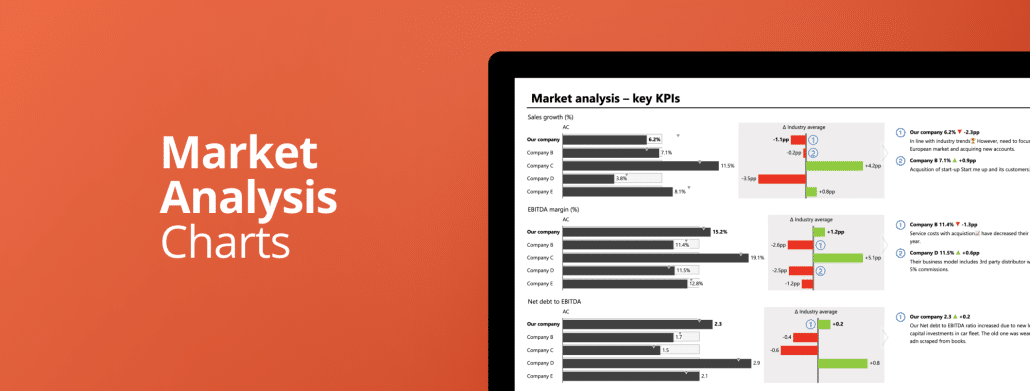
Empower strategic decision-making with our free PowerPoint template for financial management reports, a tool designed for clarity, flexibility, and actionable insights.
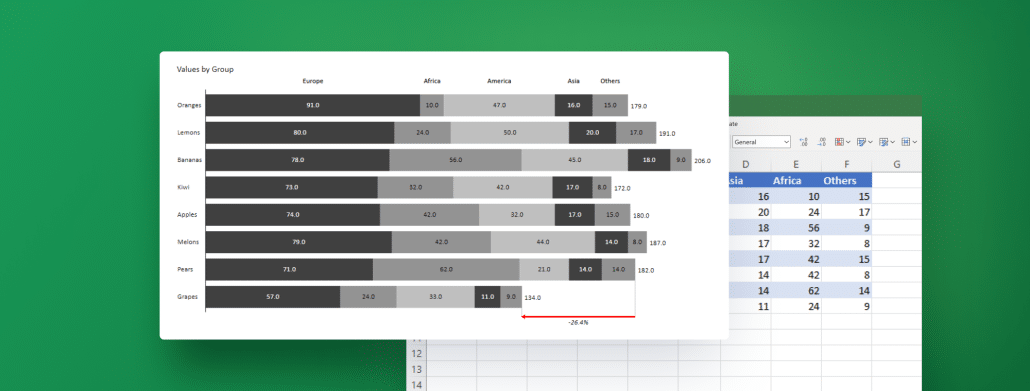
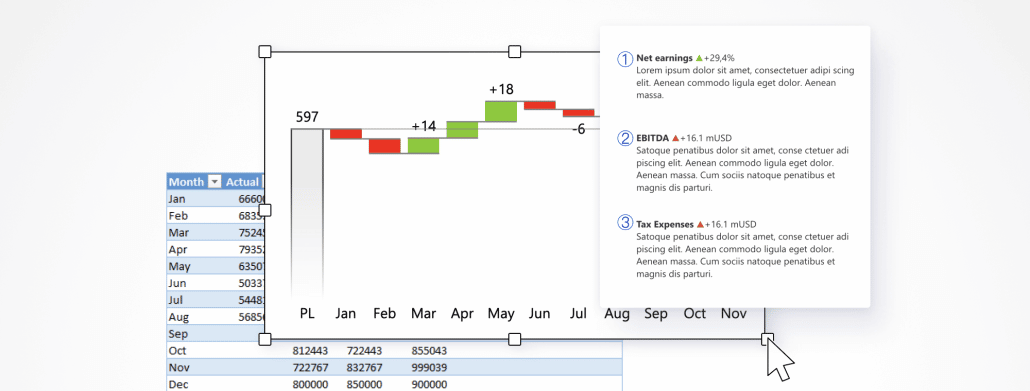
Stacked bar charts allow you to break down your data into segments, which provides your stakeholders with a comprehensive view of the information at hand. Learn how to create your best stacked bar chart in Excel with next-level features using Zebra BI for Office.
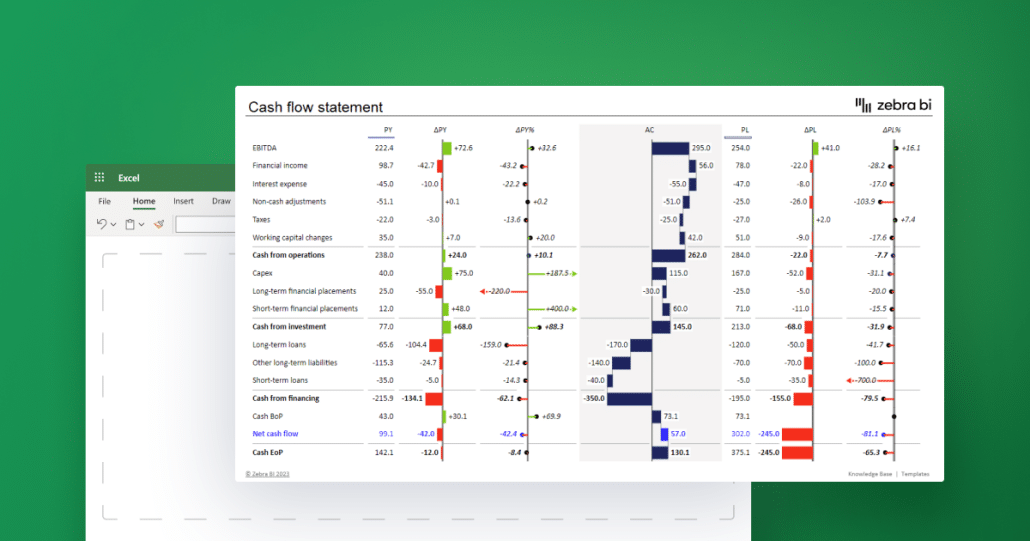
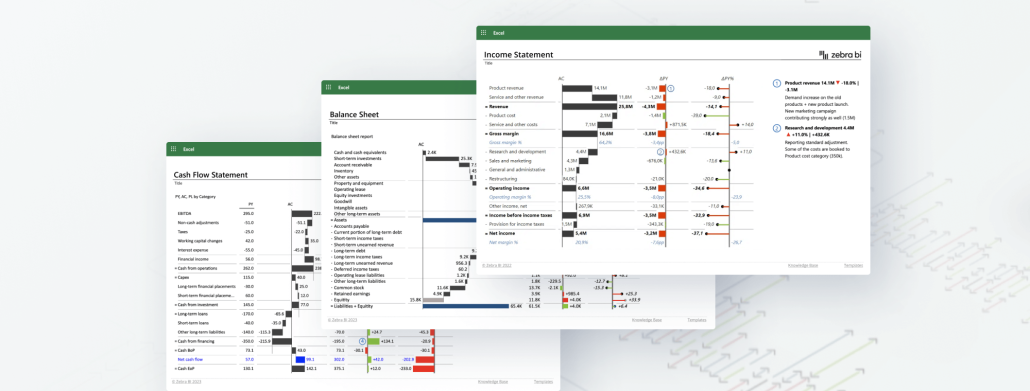
Learn how to create a powerful cash flow statement in Excel for your business. Track your cash inflows and outflows with accuracy and identify trends, risks, and opportunities.
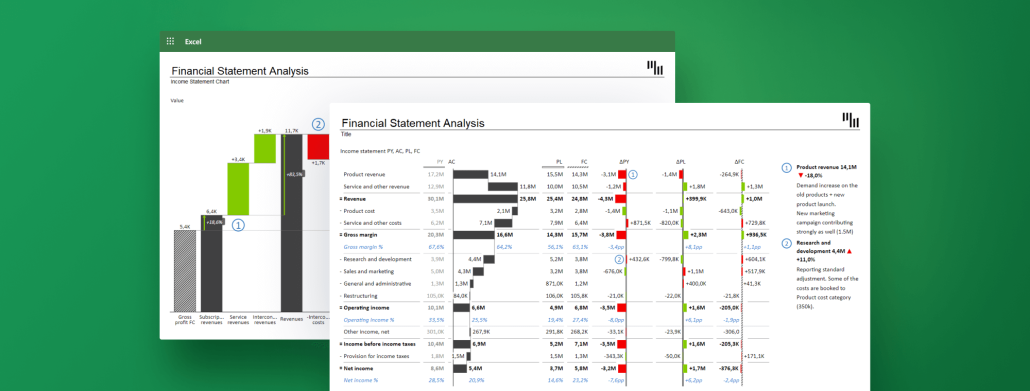
To gain insight into their financial health and progress, most companies need to prepare three essential reports – income statement, balance sheet and cash flow statement. Let's explore them one by one.
 September 8th
 February 22nd