Explore
Products
Zebra BI for Power BI
Zebra BI for Excel
Zebra BI for PowerPoint
Live Demo PBI
May 16, 2024
Live Demo Office
April 25, 2024
On-demand Product Tour
Resources
Zebra BI Academy
Resource Hub
Customer Stories
Templates
Webinars
Guides
Help
Help Center
Knowledge Base
Beginner's Guide
101 Crash Course
Chart Selector
Support
Why Zebra BI?
Our customers
Actionable reporting
Supercharge your Power BI
Calculate return on investment
Pricing
Search for:
Login
Try Zebra BI for free
Products
Zebra BI for Power BI
Zebra BI for Excel
Zebra BI for PowerPoint
Live Demo PBI
May 16, 2024
Live Demo Office
April 25, 2024
On-demand Product Tour
Pricing
Resources
Zebra BI Academy
Resource Hub
Customer Stories
Templates
Webinars
Guides
Help
Help Center
Knowledge Base
Beginner's Guide
101 Crash Course
Chart Selector
Support
Why Zebra BI
Our customers
Actionable reporting
Supercharge your Power BI
Calculate return on investment
Log In
Try For Free
Close
Upcoming webinar:
How to make your Power BI reports run up to 10x faster
September 8th
Register
Zebra BI Live Product Demo:
Start creating truly insightful Power BI reports and dashboards
February 22nd
Save the spot
Home
Resources
Warning
: Undefined property: WP_Error::$cat_ID in
/home/zebrabi/public_html/wp-content/plugins/oxygen/component-framework/components/classes/code-block.class.php(133) : eval()'d code
on line
19
Tag:
Business Reports
Tag:
Business Reports
Power BI
Guide
March 29, 2021
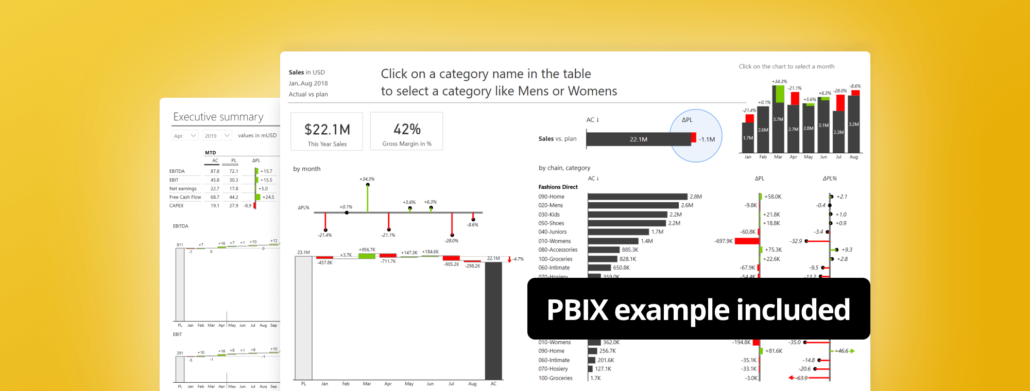
Power BI for Business Analysts: The top tools you need in your toolbox
Learn all about designing sales vs. plan performance dashboards, cost vs. budget analyses, income statements and forecasts, and more.
Read more
Blog
July 10, 2020
Power BI Course for Government by Warren Dean [community highlight]
Power BI training for Government is a new online course by our friend, Warren Dean. Check his experience in building financial reports in PBI with Zebra BI!
Read more
Power BI
Webinar
April 16, 2020
Power BI Productivity features - Build your reports amazingly FAST!
Learn how to save days or even weeks of your time when building and maintaining your Power BI reports with our indispensable best practices.
Watch now
Event
October 11, 2019
Zebra BI makes a stop at Power Platform World Tour: Brussels, 4-5 December 2019
We are ready for yet another two days of exceptional content in 32+ breakout sessions. Andrej will present how to build spectacular dashboards in PBI-
Learn more
Event
October 9, 2019
Zebra BI to hold 2 sessions at Power Platform World Tour Munich, 5-6 November 2019
It is the Zebra BI's first-time while attending #PowerPlatformWT events across the Globe, that we will hold two sessions within a single event!
Learn more
Event
October 9, 2019
Zebra BI goes to Power Platform World Tour Vienna, 29-30 October 2019
We are excited to let you know that Zebra BI will attend yet another in a series of #PowerPlatformWT events, this time in Vienna.
Learn more
Event
August 28, 2019
Zebra BI attends Power Platform World Tour Copenhagen, 11-12 September
We are happy to inform you that Zebra BI will attend yet another #PowerPlatformWT event, this time we will be in Copenhagen.
Learn more
Event
June 17, 2019
Dynamics 365 meets Power BI with Zebra BI - Antwerpen 19.06.2019
Zebra BI is headed to attend a special seminar where they will discuss how to quickly analyze data from Dynamics 365 with the help of Power BI.
Learn more
Event
April 10, 2019
Financial Reporting in Power BI with Zebra BI - Zagreb 14.06.2019
We are thrilled to announce, that we'll be running another full-day workshop on financial reporting in Power BI with Zebra BI in Zagreb.
Learn more
Pagination
1
2
…
8
»
Product
Zebra BI for Power BI
Zebra BI for Excel
Zebra BI for PowerPoint
Latest Releases
Changelog
Zebra BI for Power BI Pricing
Zebra BI for Office Pricing
Resources
Webinars
Templates
Guides
Zebra BI Academy
Blog
Community Events
Legal documentation
Help
On-demand product tour
Live product demo
Knowledge base
Beginner’s Guide
Zebra BI 101 Crash Course
Chart Selector
Company
About
Careers
Customers
Become an Affiliate
Find a Partner
Terms of Website Use
Contact Sales
Technical Support
© 2021 – 2024 Copyright Zebra BI d.d. All rights reserved. Various trademarks held by their respective owners.
Privacy Policy
Legal documentation
Try it in your Excel. For free.
angle-up
angle-down
youtube-play
question-circle-o
dropdown-down
TimelineArrow
arrow
download
facebook
ln
logo-black
menu
no
search
twitter
 September 8th
 February 22nd