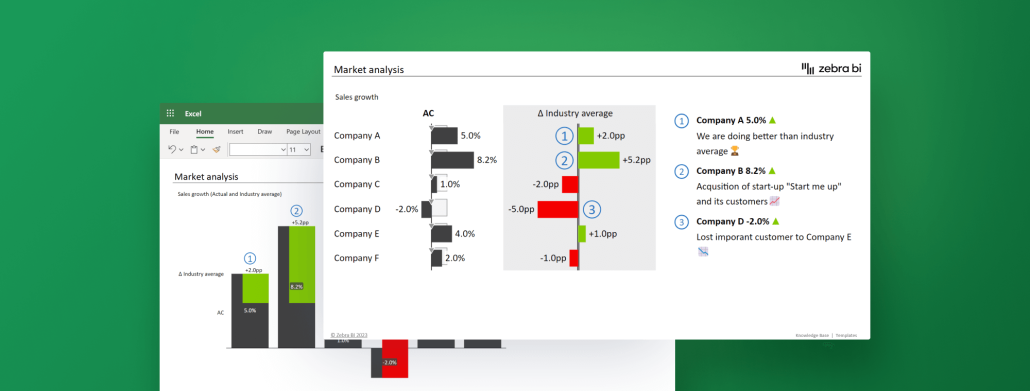
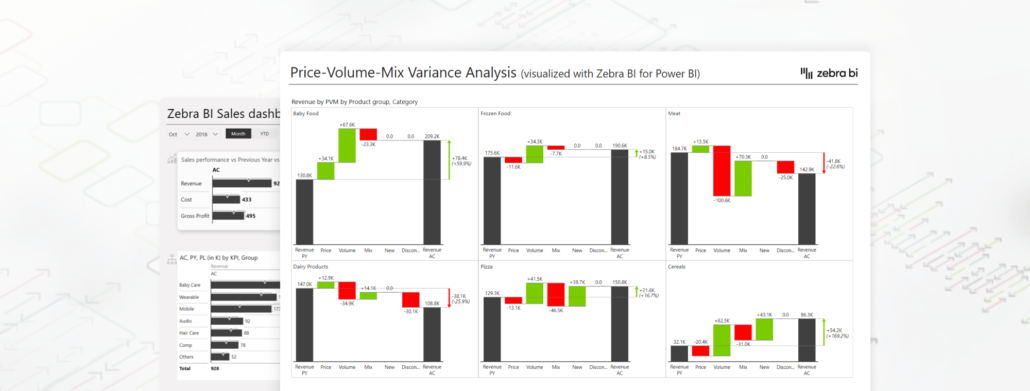
Learn to use Excel for market analysis with our step-by-step guide. Dive into your data, create effective visuals using Zebra BI for Office, and make data-driven decisions fast.
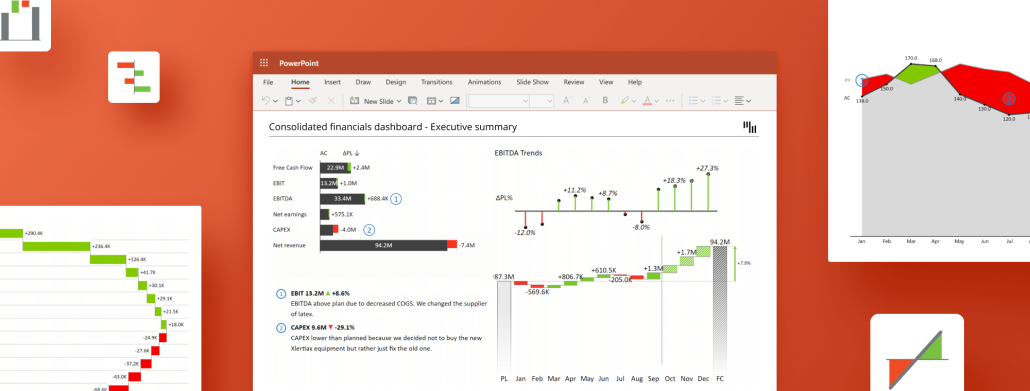
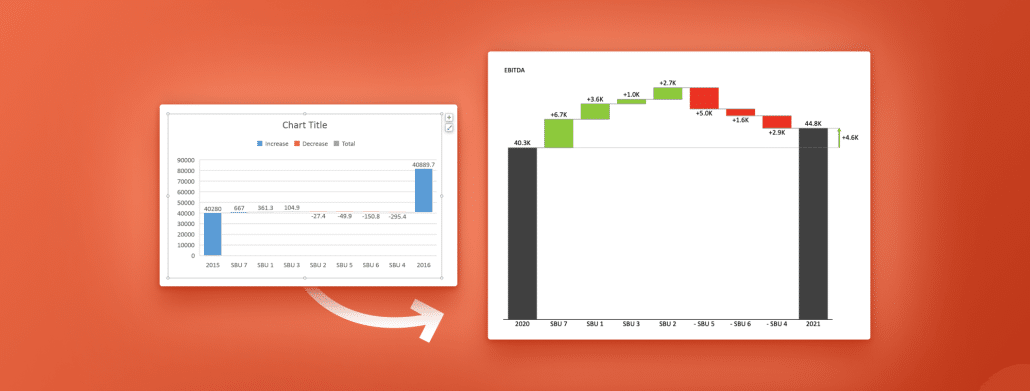
Discover the art of creating dynamic waterfall charts in PowerPoint with our in-depth guide. Ideal for beginners and advanced users seeking to enhance their presentation skills!
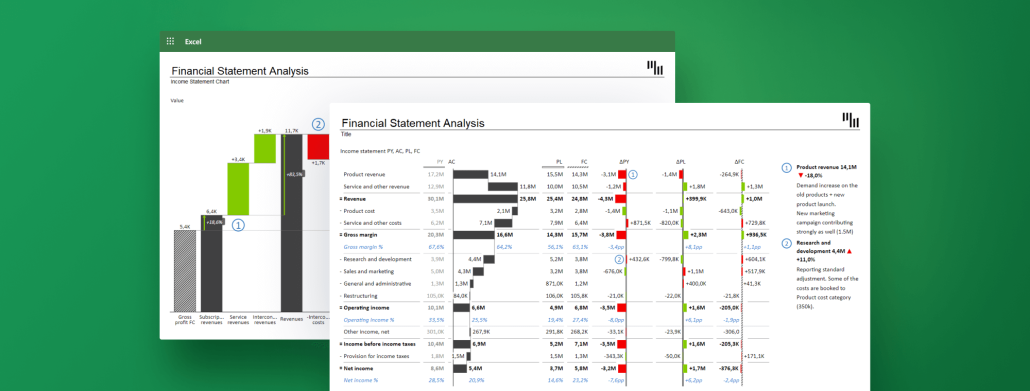
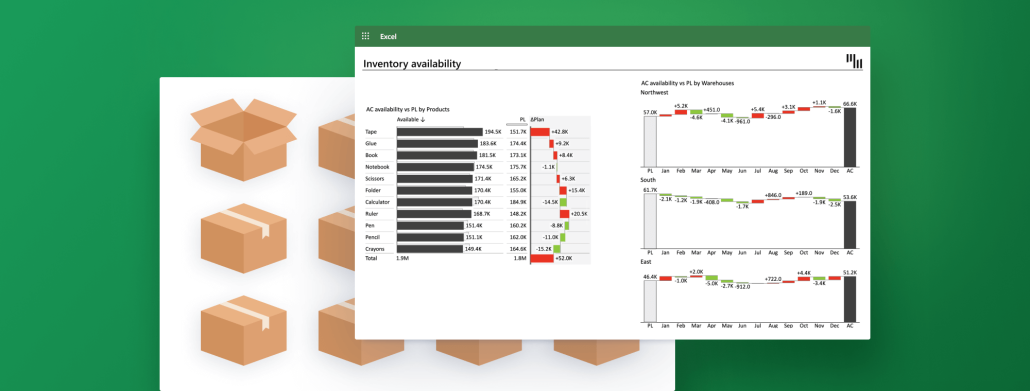
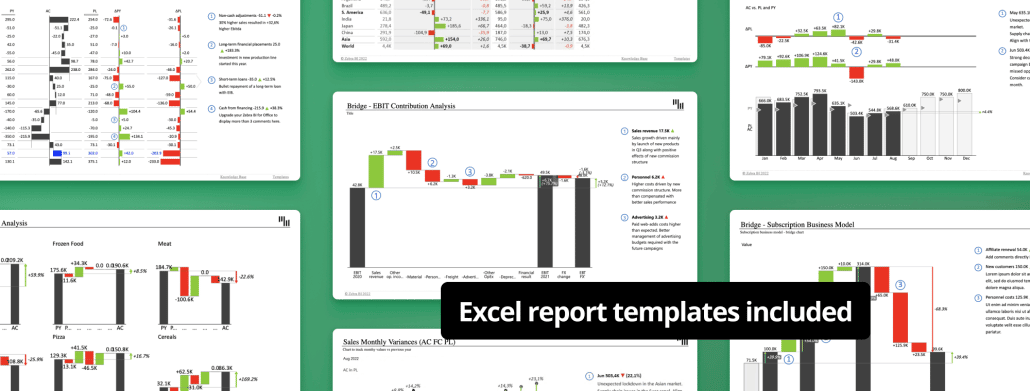
If you take just a couple of minutes, you can rethink your approach to creating and designing your business reports. In this article, you can find key Excel report templates for some of the most commonly used business reports.
 September 8th
 February 22nd