Join the early release.
Leave your email and we'll send you the setup guide, then check in a week later to see how your first report went. Or skip ahead: the install steps are right below.
 September 8th
 February 22nd
 27 Oct 2026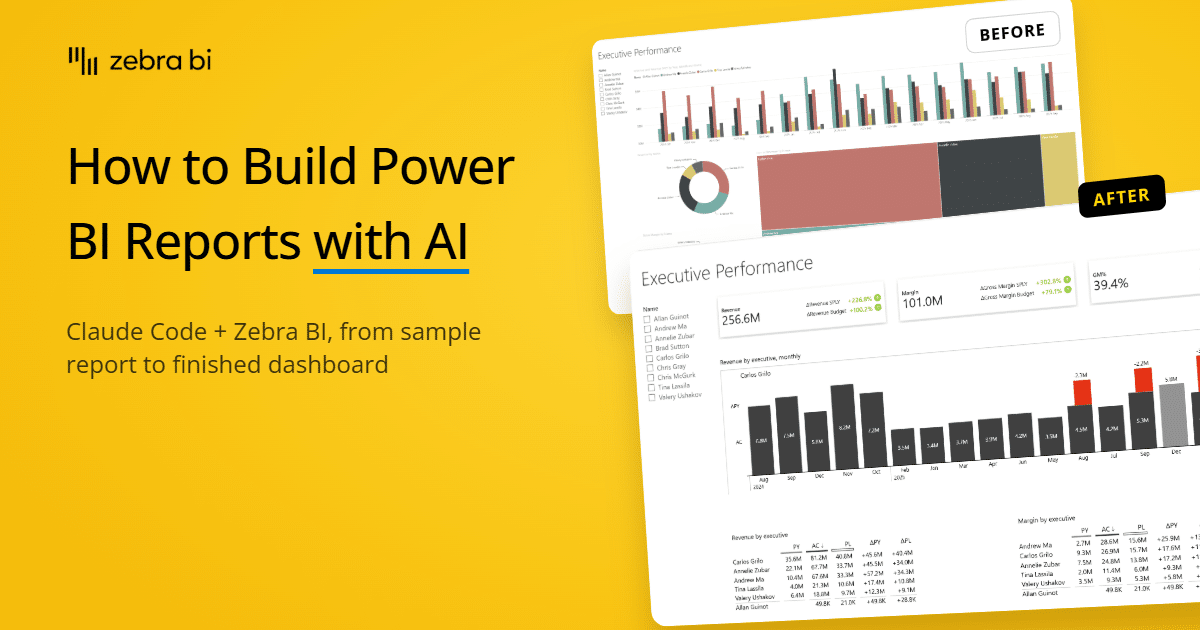
AI can build Power BI reports now. Building one your CFO reads the same way every month is a harder ask: actuals against plan, variances where they expect them, and the same rules on page 12 as on page 1.
In this summer's issue of the German finance journal REthinking Finance, Dr. Michael Knapp and Prof. Dr. Gösta Jamin of HWG Ludwigshafen showed an AI agent building a multi-page finance report in Power BI. What they ran into is the problem Zebra BI agentic is built for: it's a public agent skill that gives your AI agent the reporting rules and the visuals from the start.
Want to try it now? Skip to the install steps.
Knapp and Jamin set out to show what's technically possible when an agent does all of the work. In Claude Code, with an open-source command-line tool and skills they wrote themselves, they built a multi-tab group report on synthetic data, almost entirely through plain-language requests and the code the agent generated, without clicking through Power BI's visual editor.
Then came the reporting standard. Their first attempt applied their own IBCS skill (International Business Communication Standards, the notation many finance teams use so every report reads the same way) to standard Power BI visuals, and the results were unsatisfactory. According to the article, the breakthrough came once the skill configured Zebra BI visuals instead of bending standard ones. They also had the agent screenshot the report after every change and check it against the request before a person saw it, the same kind of check Zebra BI agentic runs.
Their lessons learned are worth reading too: precise prompts pay off immediately, version control is indispensable, and the output isn't production-ready until an experienced controller has checked it. If your German's up to it, read the whole thing.
Knapp, M. / Jamin, G.: Agentic Coding im Reporting: Wie KI-Agents Finance-Dashboards in Power BI automatisiert erstellen. REthinking Finance 4/2026, pp. 47-54.
In Knapp and Jamin's build, two things worked together: Zebra BI visuals for the reporting standard, and a skill that told the agent how to use them. By their account, that one-off investment in a skill pays for itself from the second report. They had to write it themselves. You don't.
Zebra BI agentic gives you that skill ready-made, so your agent starts out already knowing the rules. Run it on a Power BI project that already has your data, say what you want to see, and it builds the pages itself: charts, tables, variance columns and IBCS formatting, all in Zebra BI visuals. Like a good analyst, it looks at your data before it decides anything.
A real report, not a mockup. You get a Power BI project you open in Power BI Desktop, with every number tied to your data model rather than typed in. No clicking through the visual editor to get there.
Variances without writing variance formulas. Actual vs. plan and actual vs. last year, in absolute and percentage terms. Zebra BI visuals calculate the variances themselves, so the agent doesn't need to write DAX (Power BI's formula language) for them. All you need is one measure per scenario.
One reporting standard across every page. IBCS notation is built in, so actuals, plan and last year look the same way on every page, and variances always read the same way. That's what lets your CFO read page six the same way as page one.
A makeover for the reports you already have. Got a report that works but looks like every other Power BI report? Give it to the agent. It keeps your data model and rebuilds the pages with Zebra BI visuals. That's what you see in the video.
It checks its own work. A setup check confirms your machine and model are ready before you start. As it builds, a checker reads your report files and flags faults Power BI won't warn you about, like a sort that would make a table render empty, or a calculated row that would quietly inflate your grand total. Then the agent opens the report in Power BI Desktop, takes a screenshot of each page and checks what it sees.
You decide how hands-on to be. By default, it decides the structure, builds a first page and shows you, then you steer. Prefer to approve each step? Say "work with me" and it proposes before it builds.
Always work on a copy. Zebra BI agentic rewrites the report layer of the project you give it. Before you start, copy the project folder, run the agent on the copy, and keep that copy out of synced OneDrive or SharePoint folders: once Power BI Desktop saves the report, your license key is in its files. Your original stays untouched, and you can compare the two side by side.
You'll need five things:
Recommended: Node.js, a free download, runs the checker. If your IT team blocks it, skip it: the agent still builds the report and checks the rendered page.
Zebra BI agentic is on GitHub, with the full documentation, the install guide for other agents and a place to report issues. Here's the short version with Claude Code.
Open Claude Code and paste these two commands:
/plugin marketplace add zebrabi/zebra-bi-agentic
/plugin install zebra-bi@zebra-bi-collection
Then restart Claude Code. You don't need a GitHub account: the repository is public.
Using GitHub Copilot CLI? Run copilot plugin marketplace add zebrabi/zebra-bi-agentic, then copilot plugin install zebra-bi@zebra-bi-collection. For Codex and other agents, follow the install guide.
/zebra-bi:setup-doctorIt checks your machine, your model and your Zebra BI license, and tells you how to fix anything that's missing.
No Zebra BI license yet? The setup check can open the free trial page for you, or fill it in with you if you'd like (you confirm every field and consent box yourself). Your key arrives by email in a couple of minutes. Paste it into the chat, and the agent activates the visuals straight from the report. Your machine remembers the license.
Use your own words. For example:
Here's my sales model at C:\Reports\Sales.pbip. Build me a monthly P&L page with variance against plan and last year.
It builds the first page, opens it in Power BI Desktop to check how it looks, and tells you what it did and what it left out. Check the headline figures, then tell it what to change.
To get updates later, run /plugin update zebra-bi@zebra-bi-collection. The full documentation is in the GitHub repository.
Zebra BI agentic is an early release. Two things stay your job:
That's where the REthinking Finance article lands too: the agent-driven build works, but not on autopilot, and an experienced person still reviews the result.
Found something that doesn't work? Tell us on GitHub. A report that came out wrong when the agent said it was fine is the feedback we want most.
Zebra AI Labs gives you early access to what we're building behind the scenes, starting with an MCP connector, so more of the AI tools your team already uses can work with Zebra BI. MCP (Model Context Protocol) is the open standard many AI tools use to plug into other software. More on that soon.
Zebra AI is a separate product. It answers your questions in plain language with Zebra BI charts, in the browser or as a Microsoft Fabric workload. When the answer needs to become a report everyone uses every month, use Zebra BI agentic. When you need an answer now, use Zebra AI.
Join Dhaval, Luka, and Mark from Zebra BI for a live webinar: AI + Power BI + Fabric: Reports Your CFO Can Actually Read on Tuesday, October 27, 6 pm CET / 1 pm EDT / 10 am PDT. They'll rebuild an existing Power BI report live with Zebra BI agentic, show Zebra AI in Microsoft Fabric, and answer your questions.
The agent can write report files on a Mac, but it needs Power BI Desktop to open and check the report, and Power BI Desktop runs only on Windows. In practice, you'll want Windows.
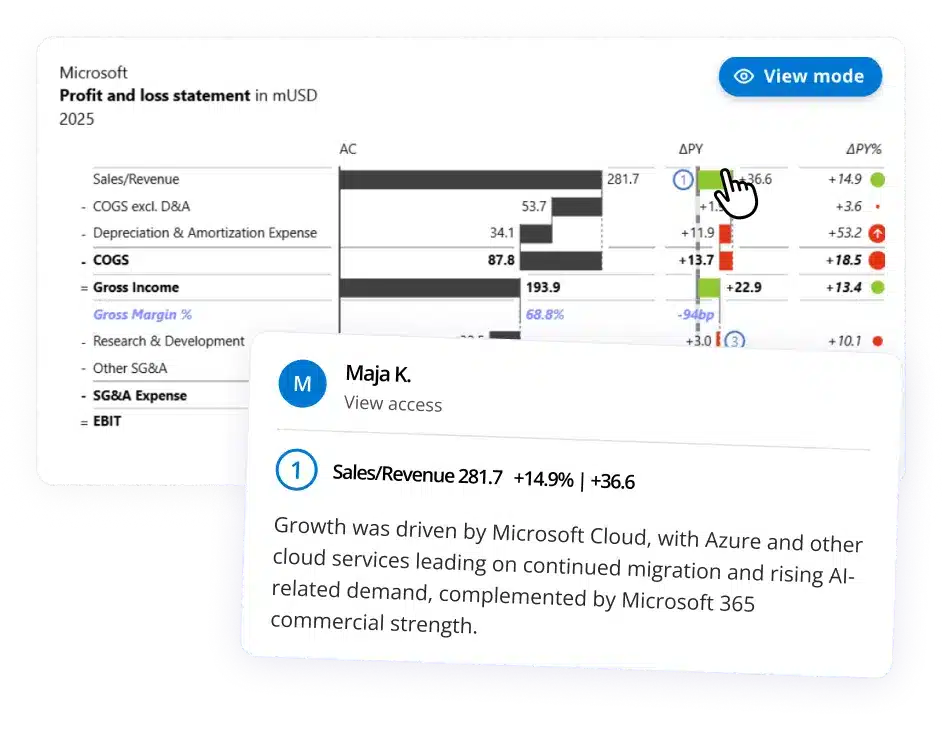
Without one, the visuals run in the free version, which has limits. A license unlocks everything, including comments in Tables+ and Charts+, for you and anyone you share the report with, the same as any Zebra BI report. The free 14-day trial covers every visual the agent uses.
No. It's included with the Zebra BI license, at no separate charge.
The Zebra BI checker runs on your machine and makes no network calls. Your AI agent works differently: it sends what it reads, including parts of your model and report, to its provider (Anthropic, for Claude Code) to process your requests, under the terms of your plan. If that's a concern, check with your IT team before you use it on sensitive data.
Yes, once you save it as a Power BI project (.pbip) in Power BI Desktop. The agent can't convert a .pbix itself, and the setup check tells you if a folder isn't a project.
The agent works on Power BI project files on your machine. To work on a published report, download it (if your workspace allows it), save it as a Power BI project and run the agent on that copy. To publish it back, Microsoft's own publishing skill does the upload, and Zebra BI agentic handles the Zebra BI part: which visuals to publish with, the license in the Service, and the refresh after upload, without which the report arrives empty.
By default, the agent uses Zebra BI Tables+ and Charts+, which let viewers comment in view mode. Power BI includes only Power BI certified visuals in native PDF export, PowerPoint export and subscription emails. If your report goes out that way, ask the agent to build it with Zebra BI Tables, Charts, and Cards which are certified.
Zebra BI Tables+ and Charts+, which the agent uses by default, aren't Power BI certified, because view-mode comments are saved to your own SharePoint, and Power BI certified visuals can't connect to outside services. They're on Microsoft AppSource, so your Power BI admin can allow them like any other AppSource visual. Or ask the agent to use Zebra BI Tables, Charts and Cards, which are Power BI certified.
Claude Code is the supported route and the one we've tested end to end. GitHub Copilot CLI installs the same way, and agents that read agent skills, such as OpenAI Codex, can load it too. We haven't built a full report on those yet, so if you try one, tell us on GitHub. The install guide covers each route.
New: Zebra BI Tables+ and Charts+