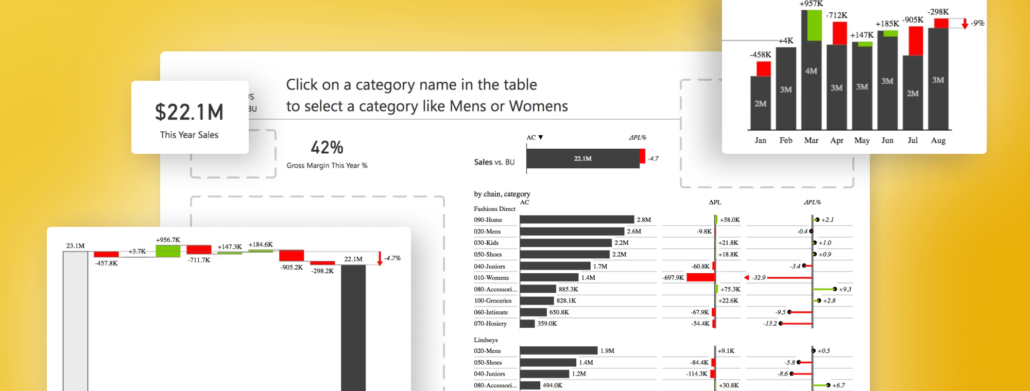
Power BI is a powerful tool for analyzing and visualizing data, but it falls short in some areas. Find out how Zebra BI visuals can make your life easier.
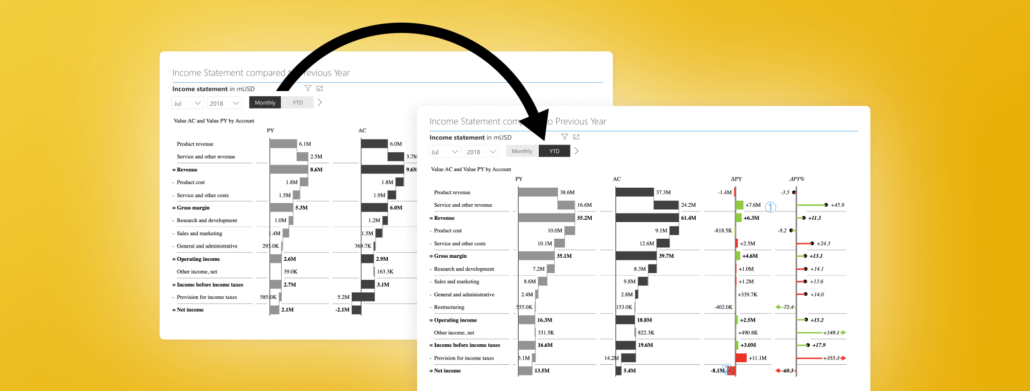
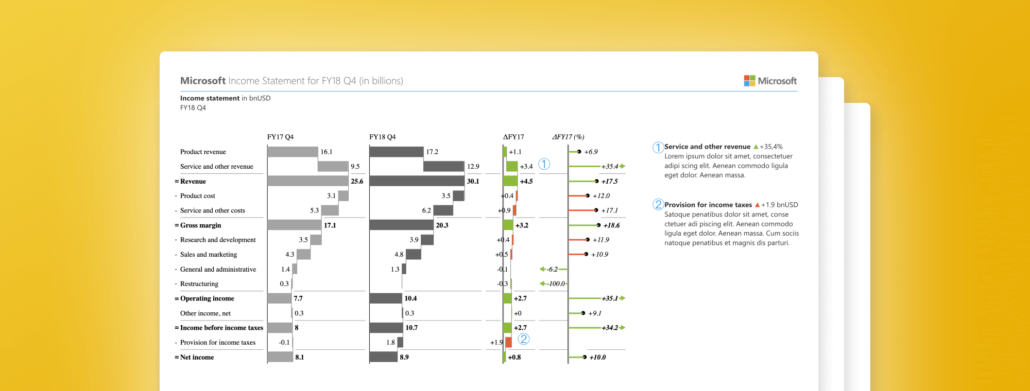
See an example of using Power BI capabilities with the advanced visualization capabilities of Zebra BI used for redesigning Microsoft's income statement.
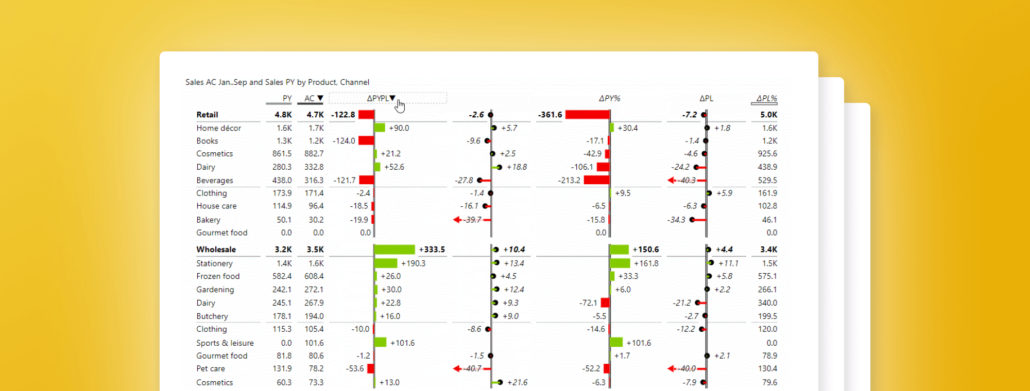
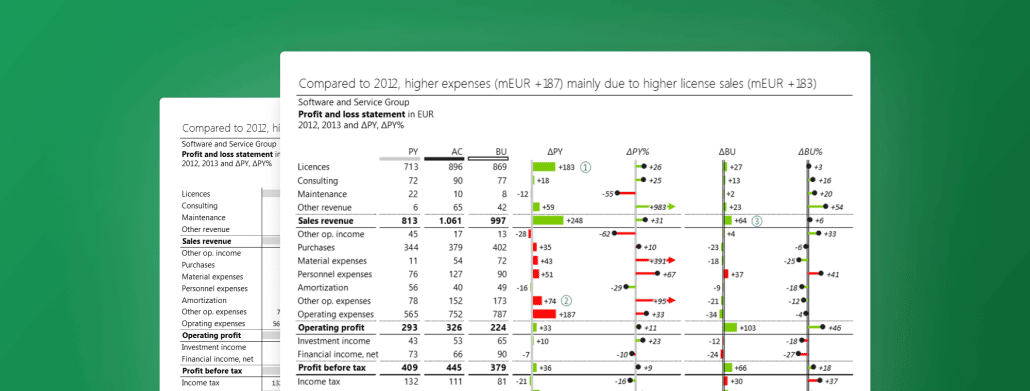
If there is one report that's a business constant, it's the income (profit & loss) statement. Learn how to create an actionable income statement in Excel
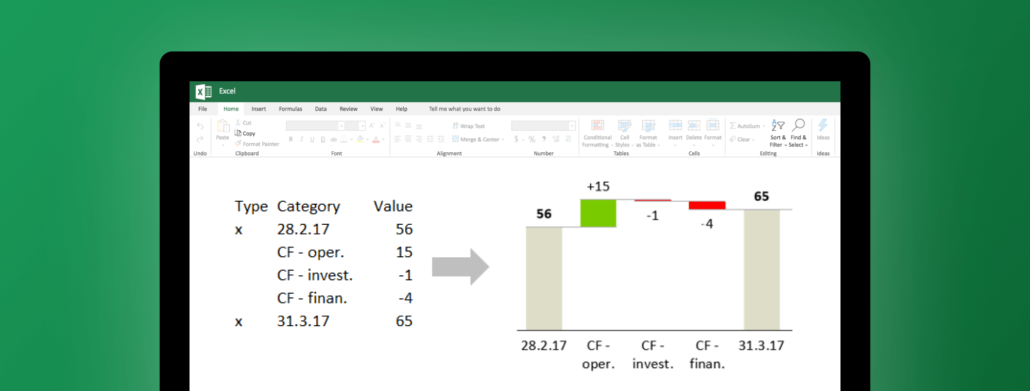
Learn how to create a visually appealing waterfall chart in Excel with our step-by-step guide. From beginners to experienced users, our guide provides all the necessary tips and tricks to impress your audience.
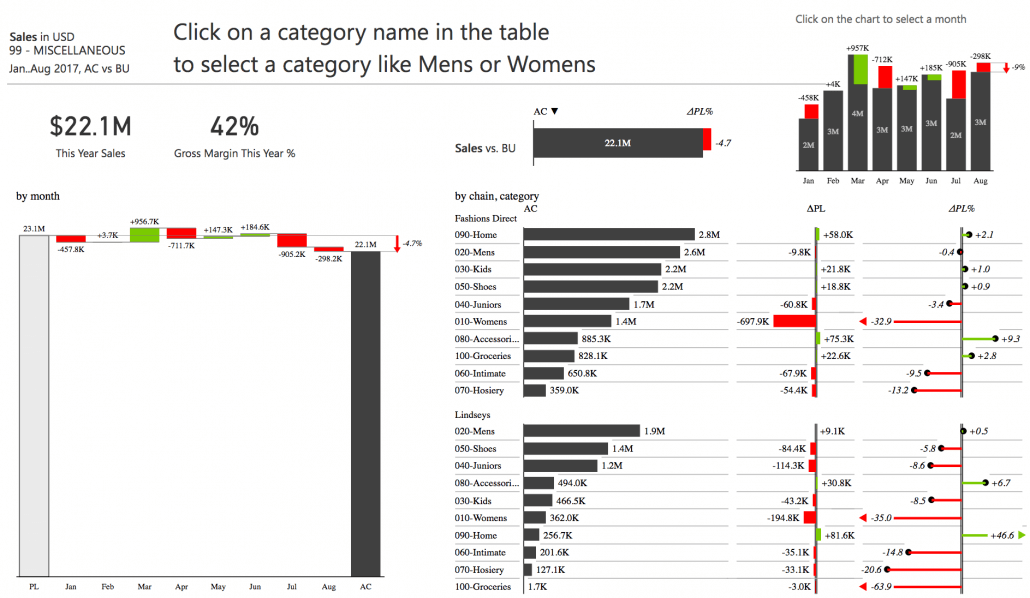
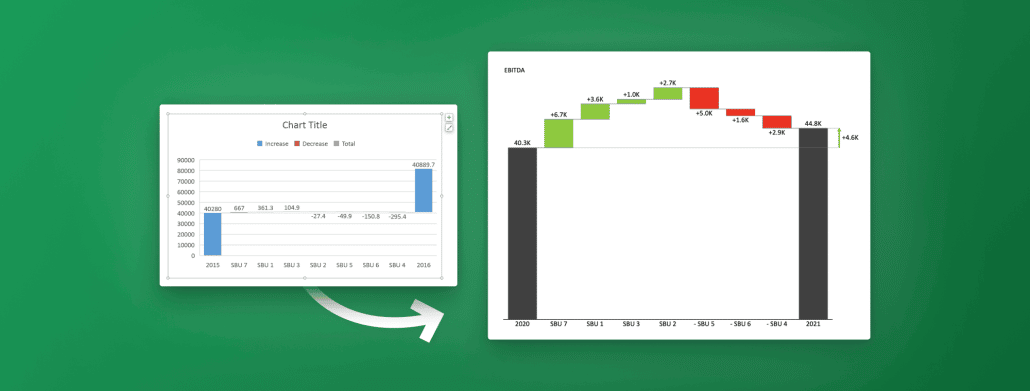
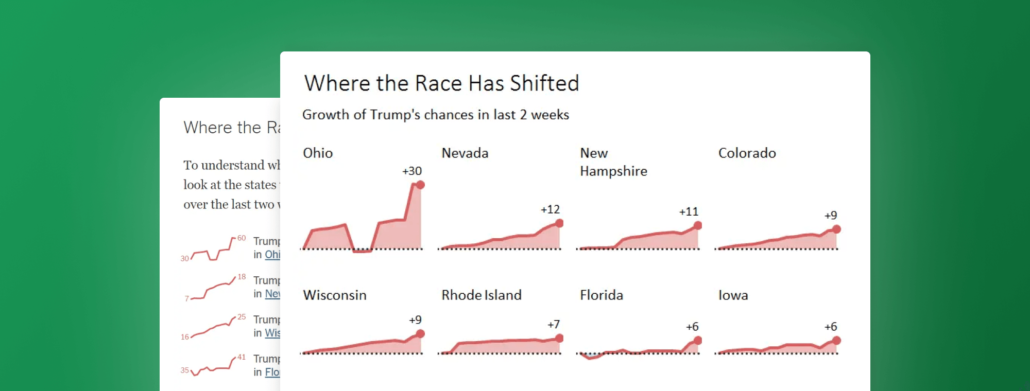
This visualization fails to convey a proper picture of the trends due to inconsistent scaling of charts. Learn 3 alternative solutions how to adress this problem.
 September 8th
 February 22nd