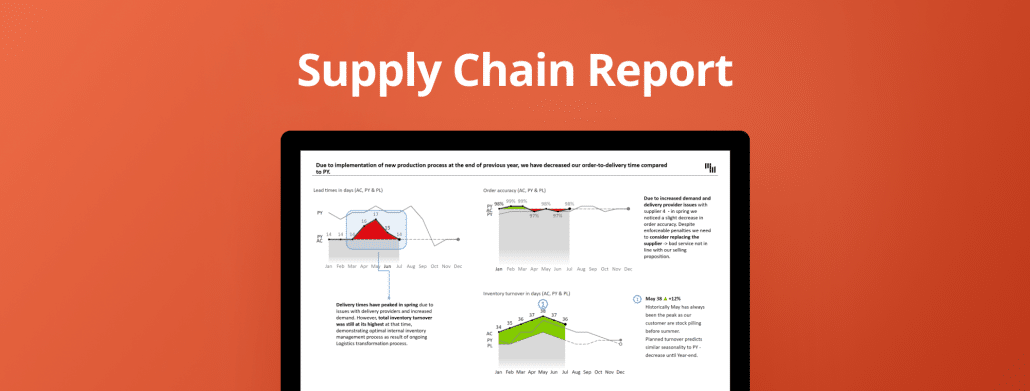
Optimize your operations with our Supply Chain Report PowerPoint Slide Deck, offering dynamic data visualization and performance tracking with Zebra BI for Office.
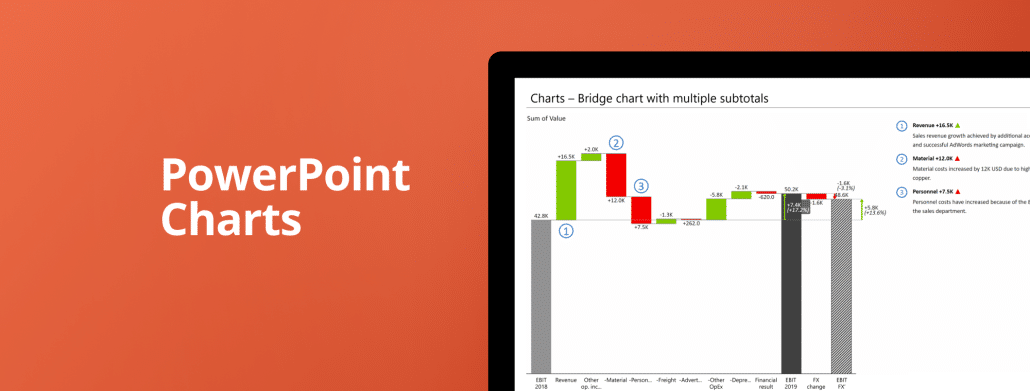
Learn how to create stunning interactive presentations with 30+ advanced PowerPoint charts and tables. All it takes is just seconds – see for yourself.
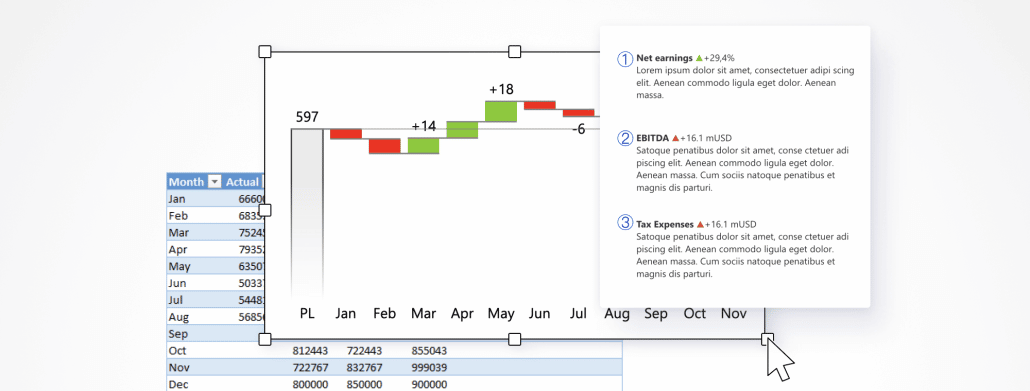
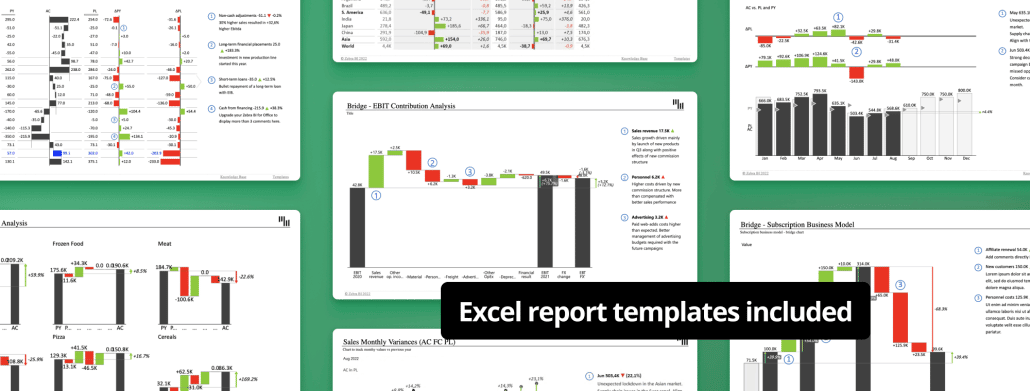
If you take just a couple of minutes, you can rethink your approach to creating and designing your business reports. In this article, you can find key Excel report templates for some of the most commonly used business reports.
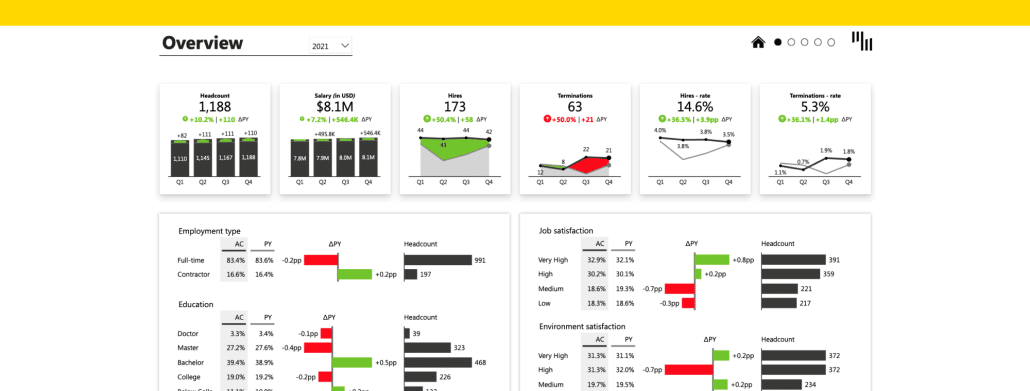
The Human Resources Power BI dashboard allows users to get a clear overview of the company's employees and the most relevant top-level KPIs: Headcount, Salaries, Hires and Terminations.
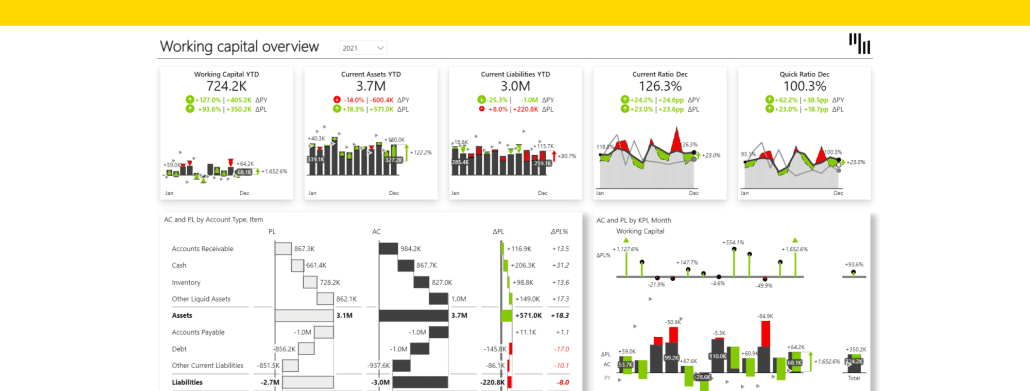
This Power BI template allows you to have a clear overview of the Current Assets, Current Liabilities and the difference between them. You can understand the balance sheet at a glance and analyze the trends of each KPI.
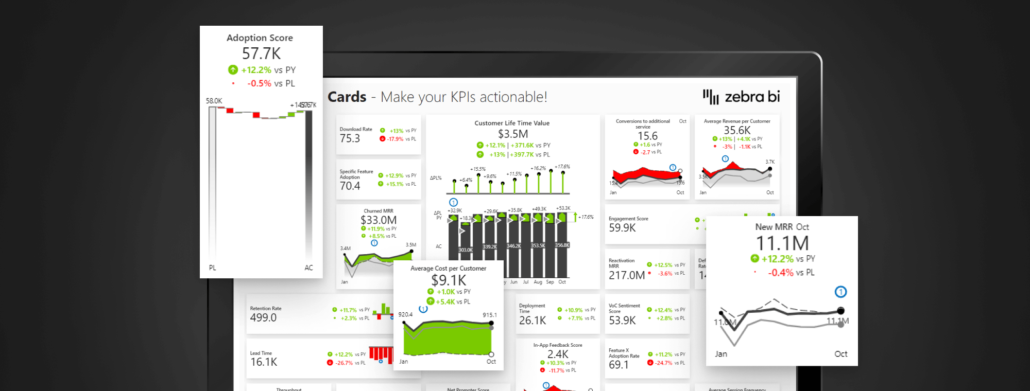
Start making decisions, based on data: from the concepts of Actionable Reporting to creating a winning landing page in Power BI. And grabbing attention where it matters.
 September 8th
 February 22nd