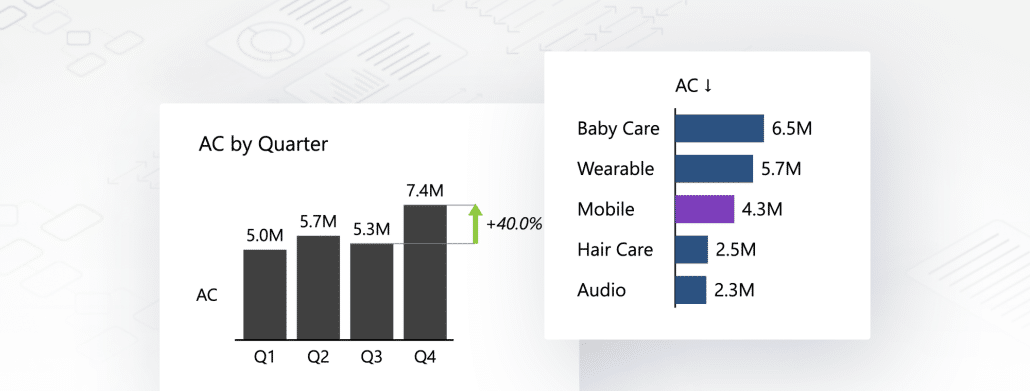
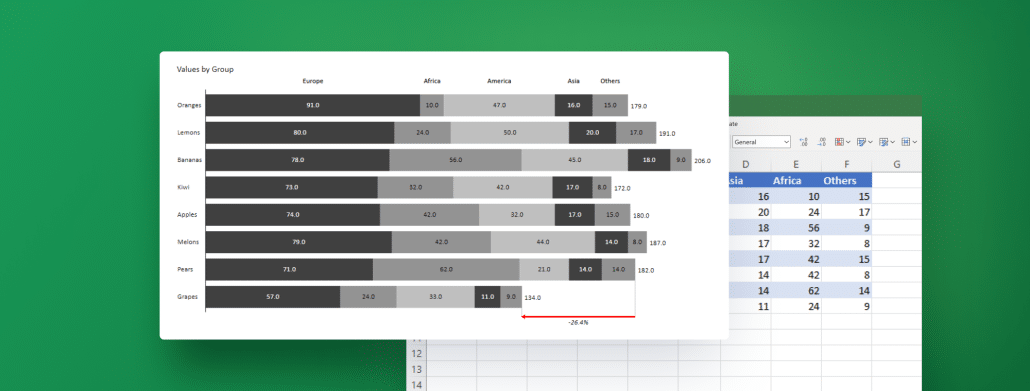
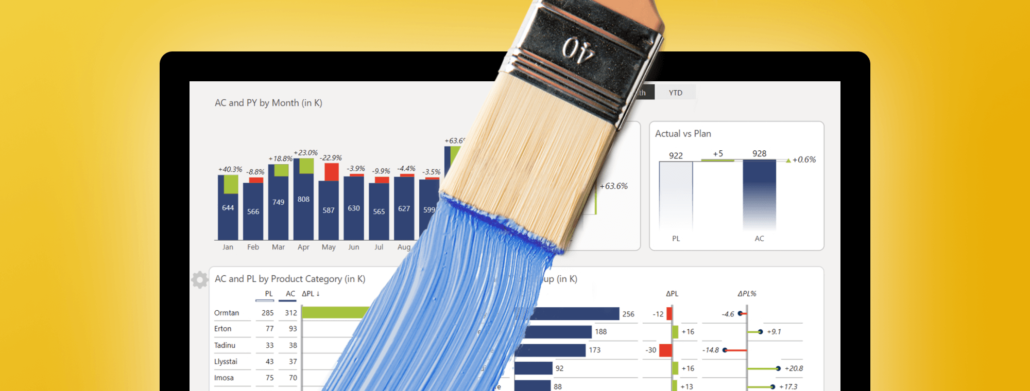
Stacked bar charts allow you to break down your data into segments, which provides your stakeholders with a comprehensive view of the information at hand. Learn how to create your best stacked bar chart in Excel with next-level features using Zebra BI for Office.
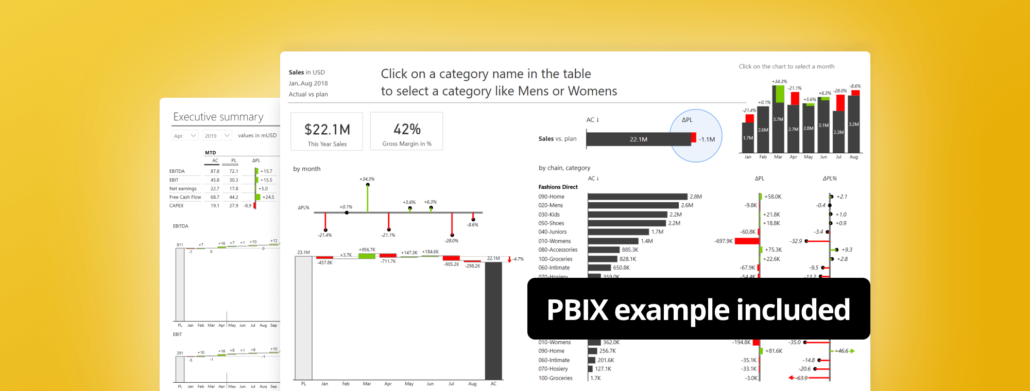
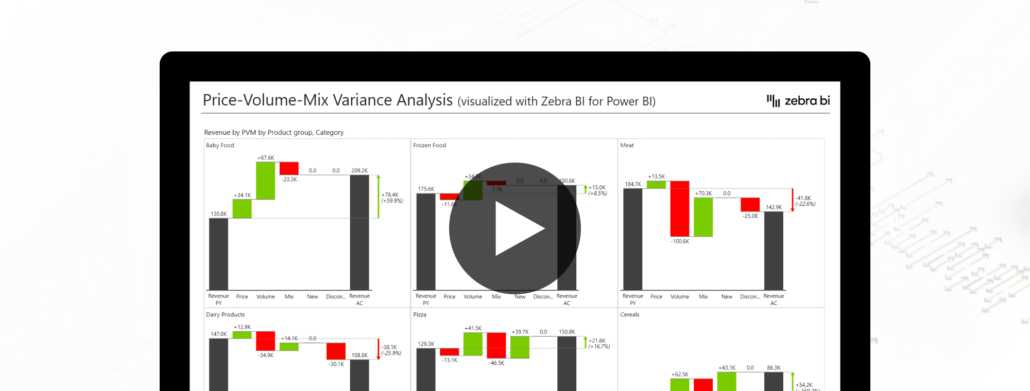
There are a lot of advanced Power BI reporting techniques to take your reports to the next level. Learn practical tips & tricks and implement them in real life.
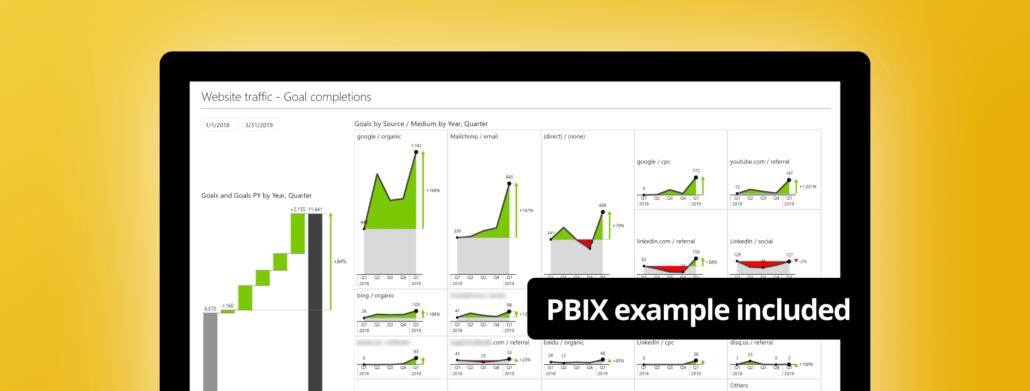
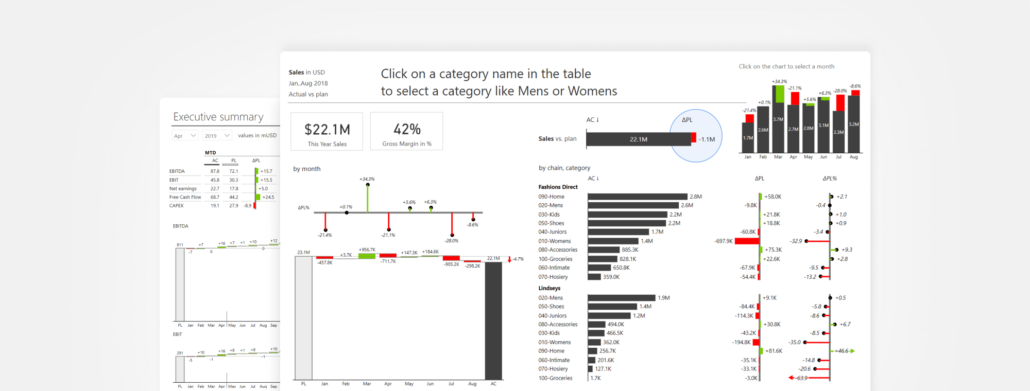
With so many possibilities in Power BI to make nice dashboards also come many challenges. Learn the top most effective tips to create them more actionable.
 September 8th
 February 22nd