Ace your investor PowerPoint presentations with our comprehensive guide on building impactful stories, emphasizing essential metrics, and skillfully employing visuals.
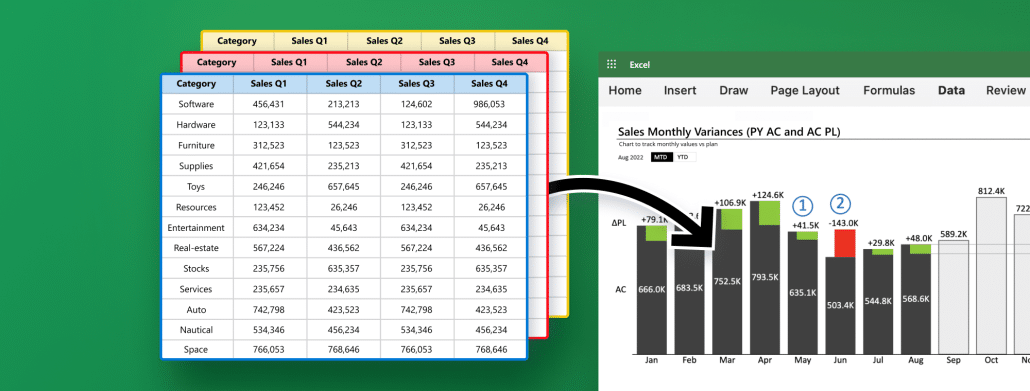
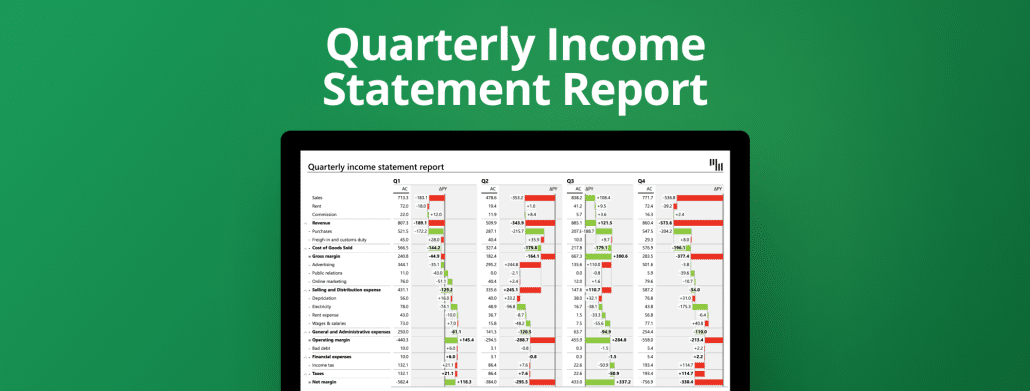
Use this template to visualize your P&L in Excel with quarterly data. The time dimension in columns lets you understand better the performance of your KPIs. By having the chance to hide unnecessary columns you can ensure an even better clarity of reports.
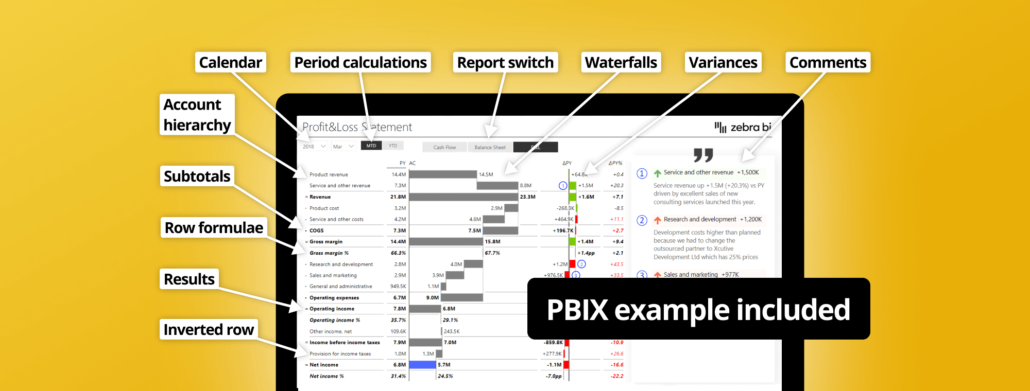
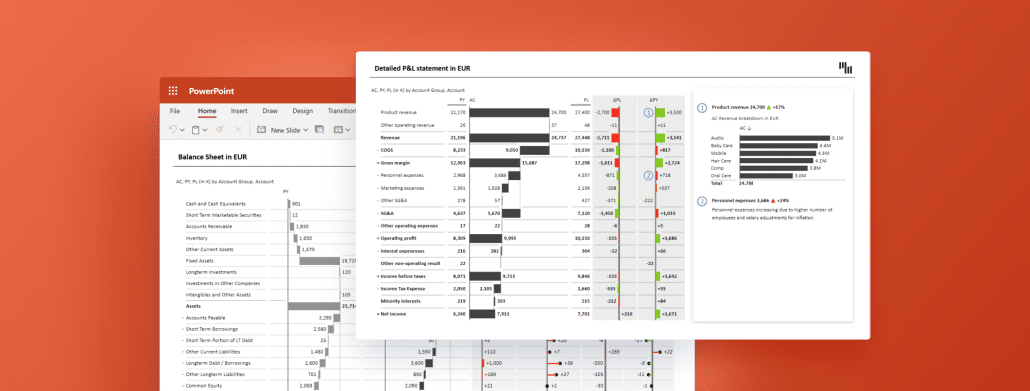
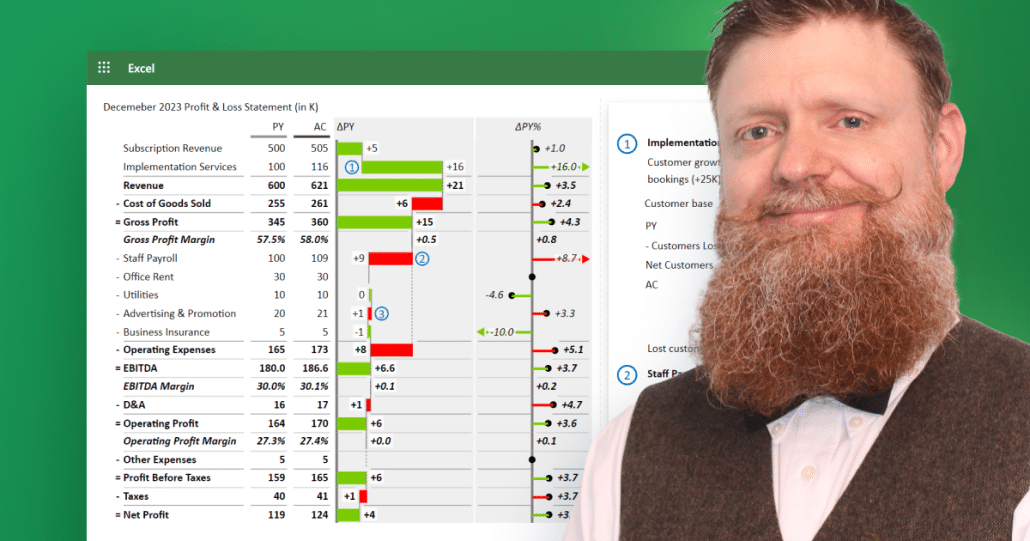
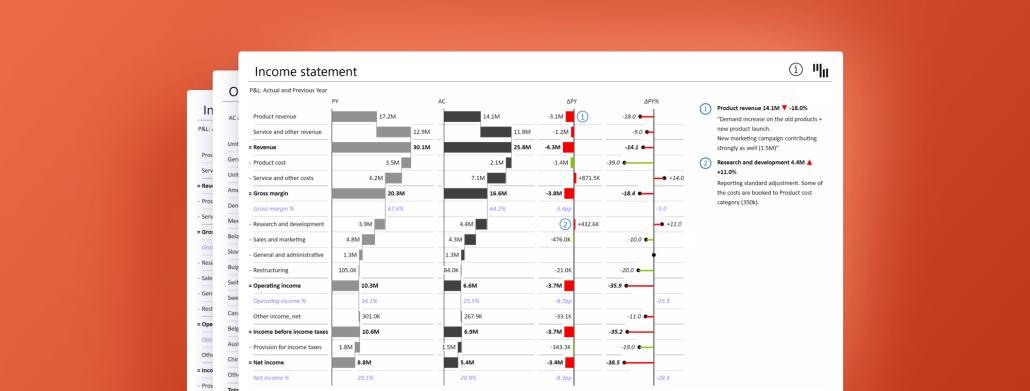
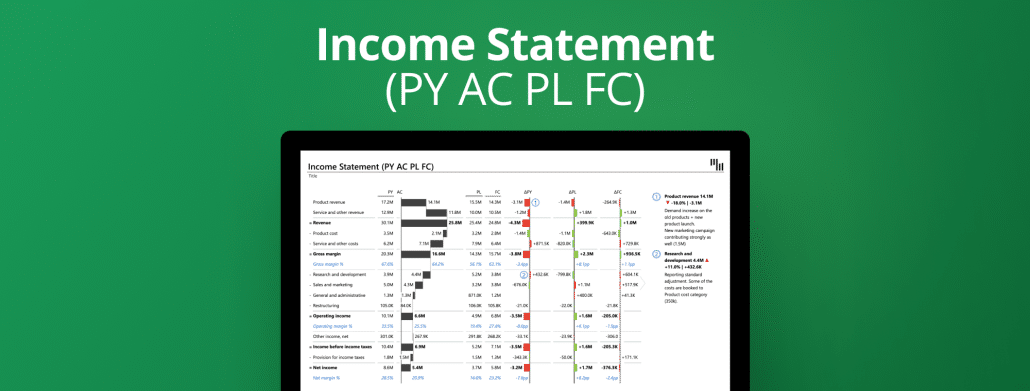
Advanced P&L in Excel with 3 comparisons: previous year, plan, and forecast visualized in one table with a waterfall chart, automatic variances & dynamic comments.
 September 8th
 February 22nd
 05 Mar 2026