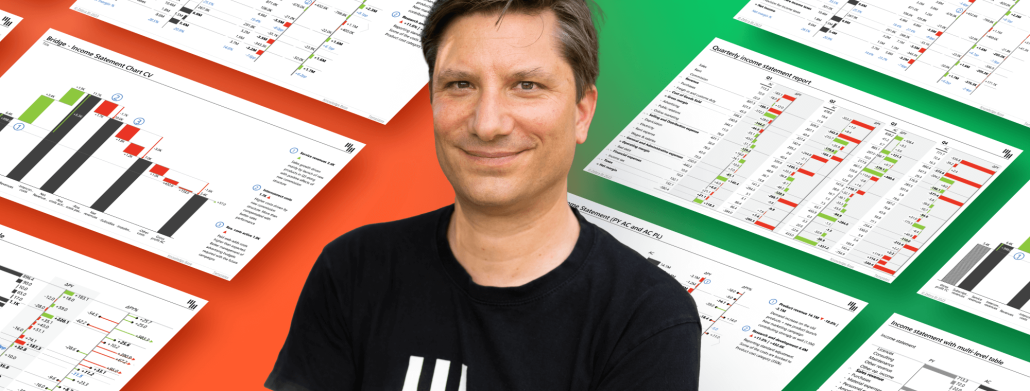
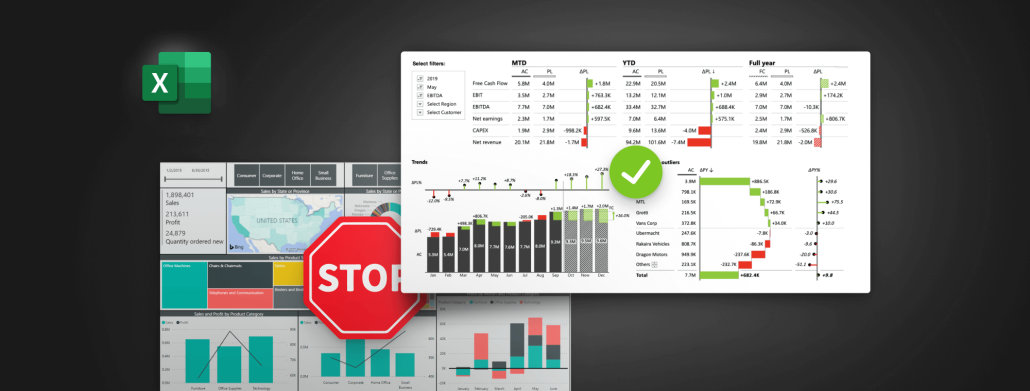
Learn how to create stunning, interactive Excel dashboards that provide immediate answers to your business questions and showcase your performance in a visually compelling way. Share your results easily and take your reporting to the next level, whether you're a seasoned BI pro or a passionate Excel enthusiast!
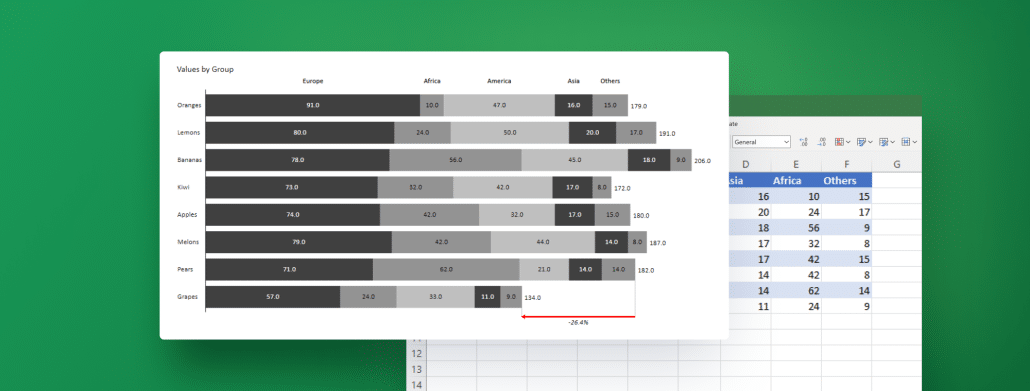
Stacked bar charts allow you to break down your data into segments, which provides your stakeholders with a comprehensive view of the information at hand. Learn how to create your best stacked bar chart in Excel with next-level features using Zebra BI for Office.
Learn how to create stunning, interactive Excel dashboards that provide immediate answers to your business questions and showcase your performance in a visually compelling way. Share your results easily and take your reporting to the next level, whether you're a seasoned BI pro or a passionate Excel enthusiast!
 September 8th
 February 22nd
 05 Mar 2026