Category: Dashboard Tips & Tricks

March 28, 2024
How to Create and Maintain Interactive Dashboards in Power BI
Learn how to create and maintain interactive dashboards in Power BI with our comprehensive guide.
March 18, 2024
How to Calculate and Interpret Financial Ratios in Excel
This comprehensive guide will teach you how to calculate and interpret financial ratios in Excel.
PowerPoint
March 16, 2024
How to Prepare Financial Statements in PowerPoint
Follow our step-by-step guide to create professional and visually appealing financial statements in PowerPoint.
December 4, 2023
The Future of Data Storytelling: Actionable Intelligence [AI, Power BI, and Office]
Learn about Actionable Intelligence and its role in data storytelling. AI is the future, but Power BI and Office are here to stay.
November 29, 2023
Leila Gharani x Zebra BI: How To Design A Perfect Excel Dashboard From Scratch
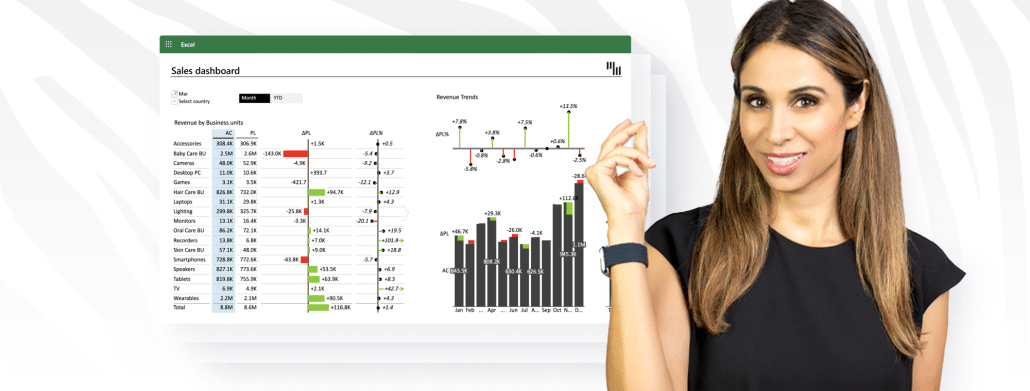
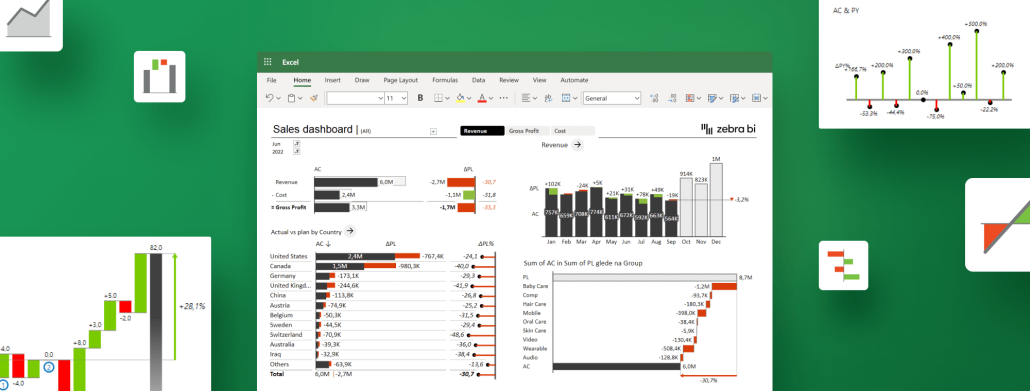
Discover key tips for Excel dashboard creation with Leila Gharani's tutorial and enhance your skills using Zebra BI's advanced tools for optimal analysis.
August 7, 2023
Interactive Excel Dashboards: Master Cross-Visual Filtering In 3 Easy Steps like in Power BI
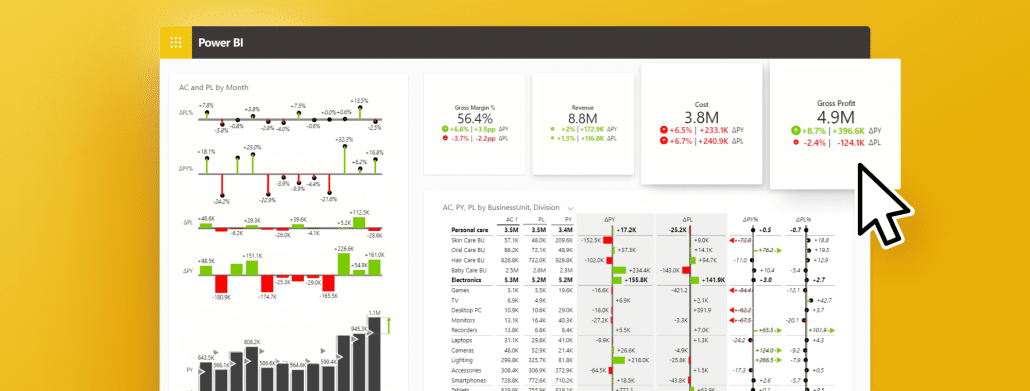
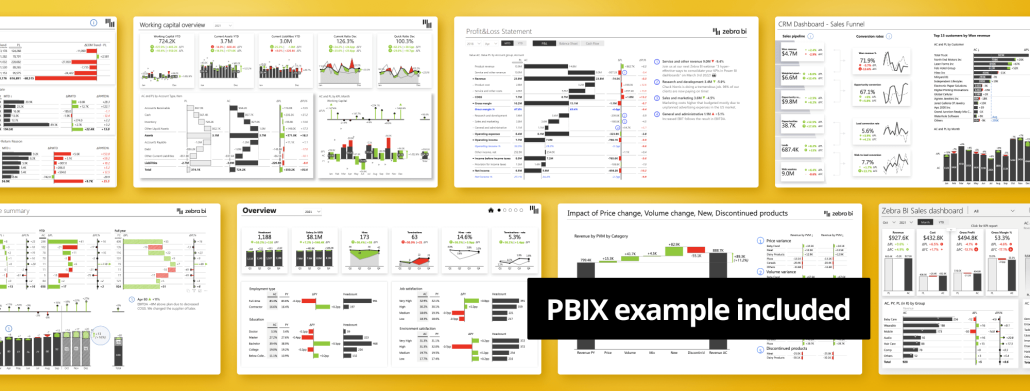
Explore Cross-Visual Filtering in dashboards. Enhance interactive data analysis in Excel & Power BI for sharper insights and informed business choices.
May 22, 2023
Top 8 Management Reports in Power BI in 2024
Explore the top 8 management reports in Power BI and elevate your analytics with the advanced capabilities of Zebra BI in our comprehensive guide.
March 22, 2023
Must-Know Tricks for Interactive Excel Dashboards in 2024
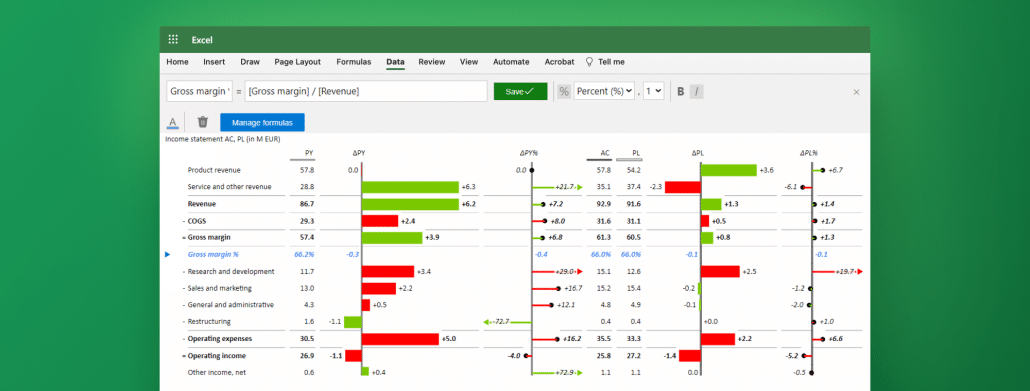
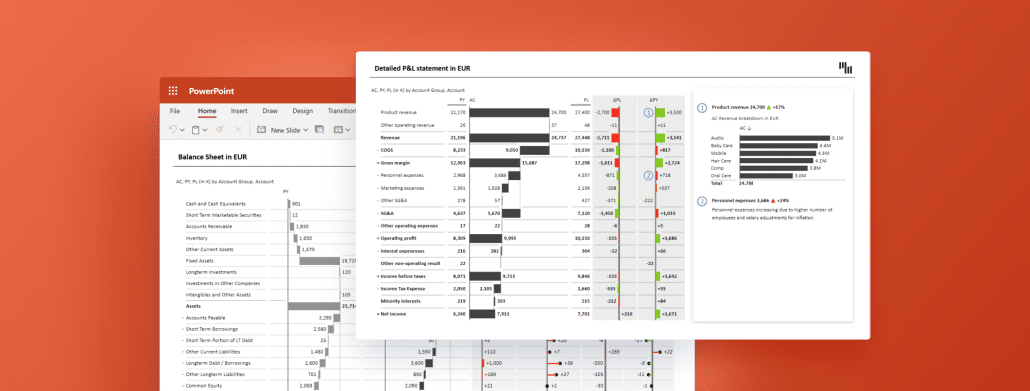
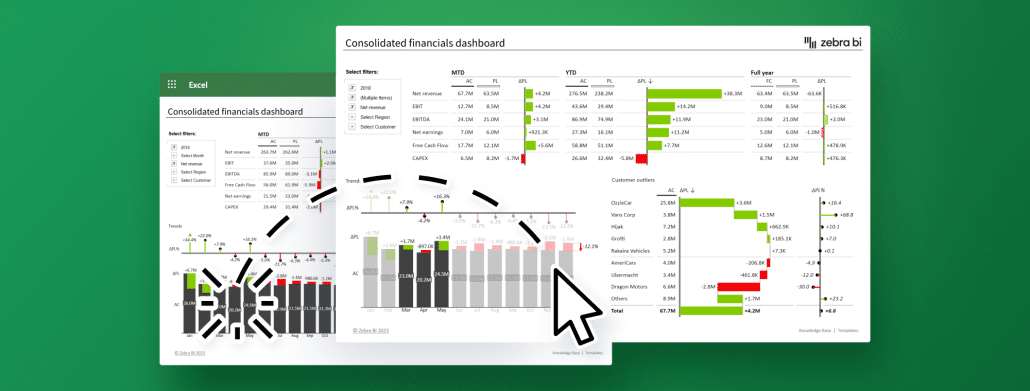
Learn the must-know tricks for creating compelling interactive Excel dashboards that deliver key business insights at a glance. Level up your reporting while saving yourself some precious time.
October 5, 2022
Power BI Performance Optimization Checklist
Slow-loading reports are a waste of everyone's time. But this checklist can help. Optimizing Power BI performance has never been easier!

Pagination