Products
Zebra BI for Power BI
Zebra BI for Office
Zebra AI
NEW
On-Demand Product Demo
10 min
Zebra BI Live Demo
September 16, 2026
Solutions
BROWSE BY TEAM
Solutions overview
Finance & FP&A
Sales & Revenue
Executive & Board Reporting
Resources
GETTING STARTED
How to start with Zebra BI?
Zebra BI Academy
RESOURCES
Resource Hub
Templates
Webinars
Guides
Customer Stories
HELP
Knowledge Base
Product updates
Contact support
Customers
Pricing
Search for
Login
Try Zebra BI for free
Try For Free
Products
Zebra BI for Power BI
Zebra BI for Office
Zebra AI
NEW
Zebra BI live demo
September 16, 2026
On-Demand Product Demo
10 min
Customers
Partners
Pricing
Solutions
Solutions overview
Finance & FP&A
Sales & Revenue
Executive & Board Reporting
Resources
How to start with Zebra BI?
Zebra BI Academy
Resource Hub
Templates
Webinars
Guides
Customer Stories
Help
Help Center
Knowledge Base
Beginner's Guide
101 Crash Course
Chart Selector
Product updates
Contact support
Why Zebra BI
Our customers
Actionable reporting
Supercharge your Power BI
Calculate return on investment
Log In
Close
Upcoming webinar:
How to make your Power BI reports run up to 10x faster
September 8th
Register
Zebra BI Live Product Demo:
Start creating truly insightful Power BI reports and dashboards
February 22nd
Save the spot
Home
Resources
Category:
Data Visualization
Category:
Data Visualization
Excel
Guide
March 24, 2016
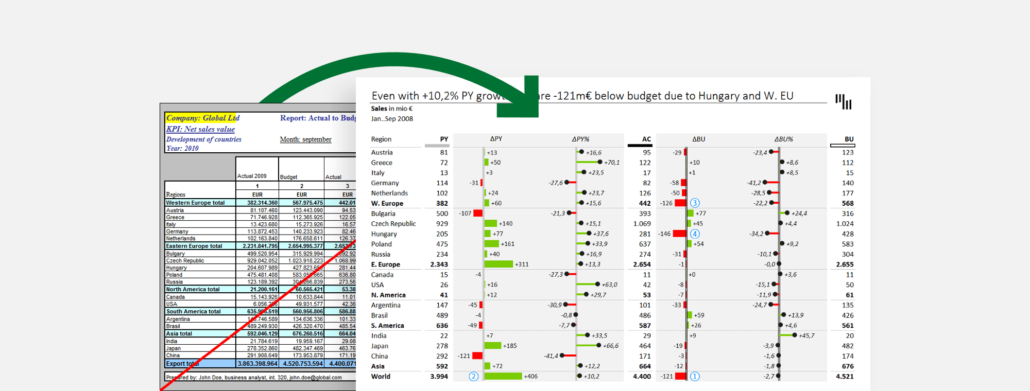
Top 3 Ways to Report your Variance Analysis in Excel
There are a couple of different ways to perform variance analysis. Learn how to easily do it in Excel in 3 ways and improve your reporting.
Read more
Excel
Guide
March 23, 2016
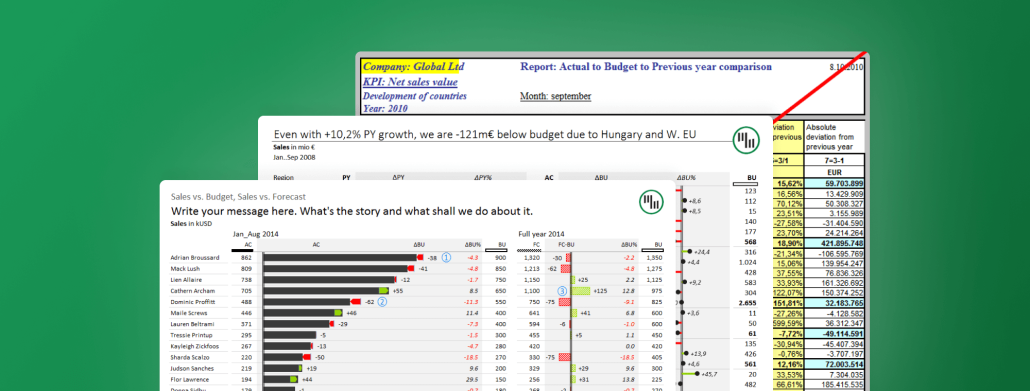
8 Steps to Creating an Efficient Variance Report
The internet is full of bad examples of variance reports. Follow this guide to see how we turn one such example into a great and efficient variance report.
Read more
Excel
Guide
March 3, 2016
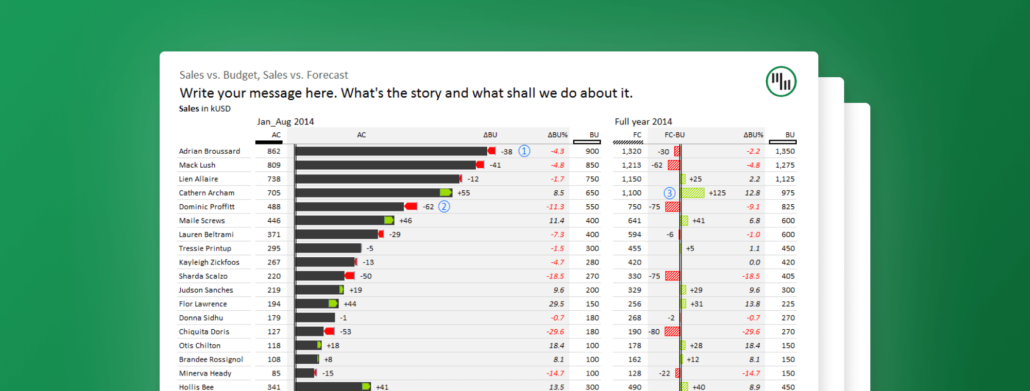
Struggling to visualize your data? Zebra BI's got you covered!
Whether it’s waterfall charts, variance charts, or lollipop charts, Zebra BI has everything you need to visualize your data for all to understand.
Read more
Excel
Guide
February 5, 2016
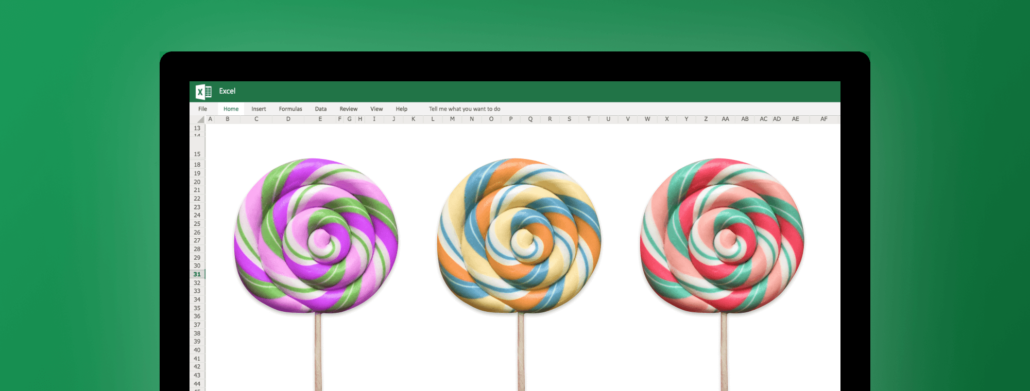
The fastest way to insert lollipop charts in Excel
Lollipop charts can be used in similar situations as bar charts and column charts, but they have the advantage of producing a cleaner-looking picture.
Read more
Excel
Guide
January 19, 2016
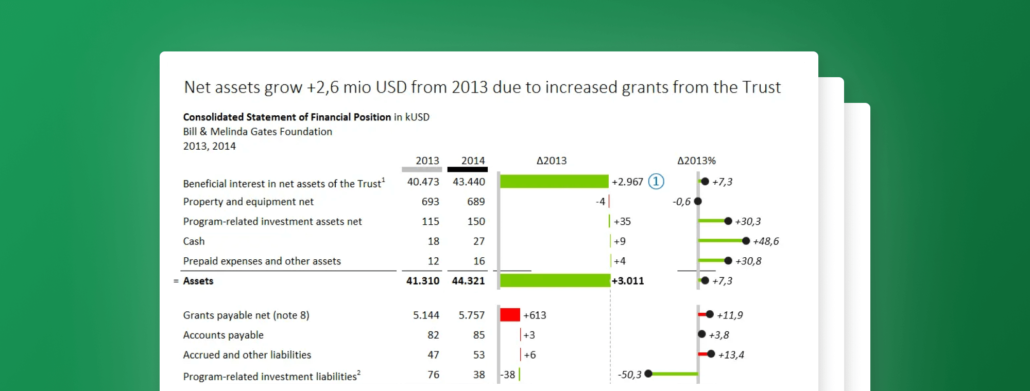
Designing Financial Statements for Non-Profits & Foundations - The Gates Foundation example
This time we'll take a deep dive into the 2014 annual report of Bill & Melinda Gates Foundation. Check how we redesigned their financial statement.
Read more
Excel
Guide
January 12, 2016
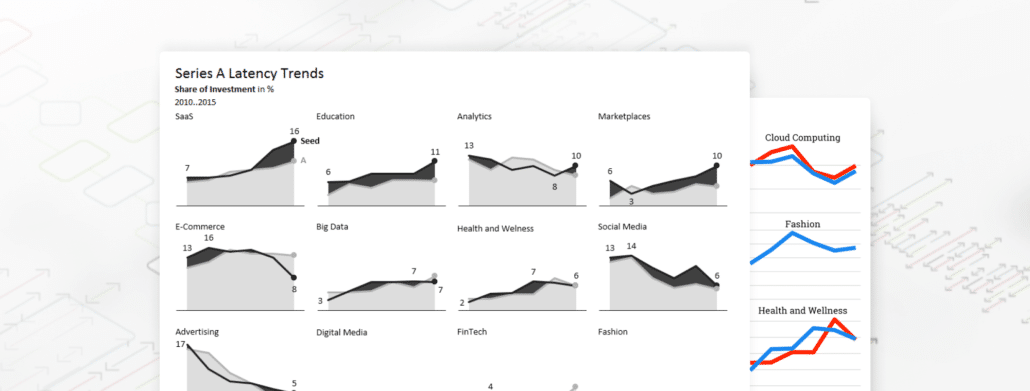
How to visualize trends for multiple markets, products, etc.
Recently, my attention was drawn to an interesting analysis of The Hottest Startup Sectors In 2016. See how we analyzed and redesigned the data.
Read more
Excel
Guide
October 9, 2015
Making small multiples in Excel
Everything is possible in Excel, but some things just take forever. Find out how Zebra BI can help you create small multiples in just 1 click!
Read more
Excel
Guide
October 8, 2015
Designing financial reports, dashboards and business presentations
Design your reporting tools more clearly ans consistently throughout your company. Get to know the importance of IBCS standards in reporting.
Read more
Excel
Guide
August 13, 2015
How to Choose the Right Business Chart - A 3-step Tutorial
In this article we will explain how to choose the right chart for your data. Or more precisely, for your message.
Read more
Product
Zebra BI for Power BI
Zebra BI for Office
Zebra AI
Solutions
Latest Releases
Changelog
Pricing
Resources
Webinars
Templates
Guides
Customer Stories
Zebra BI Academy
Blog
Community Events
Legal documentation
Help
On-demand product tour
Live product demo
Knowledge base
Beginner’s Guide
Zebra BI 101 Crash Course
Chart Selector
Company
About
Careers
Customers
Become an Affiliate
Partner Program
Terms of Website Use
Contact Sales
Technical Support
© 2021 – 2026 Copyright Zebra BI d.d. All rights reserved. Various trademarks held by their respective owners.
EULA
Privacy Policy
Cookie Declaration
Product
Zebra BI for Power BI
Zebra BI for Office
Zebra AI
Solutions
Latest Releases
Changelog
Pricing
Resources
Webinars
Templates
Guides
Customer Stories
Zebra BI Academy
Blog
Community Events
Legal documentation
Help
On-demand product tour
Live product demo
Knowledge base
Beginner’s Guide
Zebra BI 101 Crash Course
Chart Selector
Company
About
Careers
Customers
Become an Affiliate
Partner Program
Terms of Website Use
Contact Sales
Technical Support
© 2021 – 2026 Copyright Zebra BI d.d. All rights reserved. Various trademarks held by their respective owners.
Privacy Policy
Cookie Declaration
Try it in your Excel. For free.
Try it in your Excel. For free.
angle-up
angle-down
youtube-play
question-circle-o
dropdown-down
TimelineArrow
arrow
download
facebook
ln
logo-black
menu
no
search
twitter
 September 8th
 February 22nd