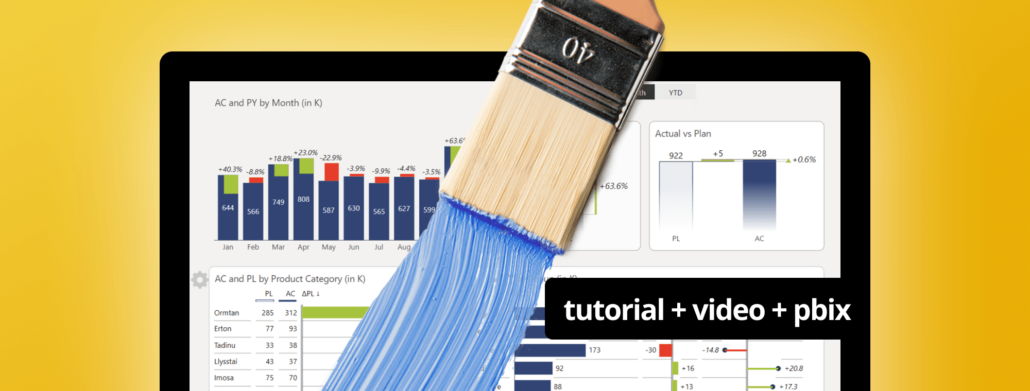
Learn how to create stunning, interactive Excel dashboards that provide immediate answers to your business questions and showcase your performance in a visually compelling way. Share your results easily and take your reporting to the next level, whether you're a seasoned BI pro or a passionate Excel enthusiast!
Learn how to create stunning, interactive Excel dashboards that provide immediate answers to your business questions and showcase your performance in a visually compelling way. Share your results easily and take your reporting to the next level, whether you're a seasoned BI pro or a passionate Excel enthusiast!
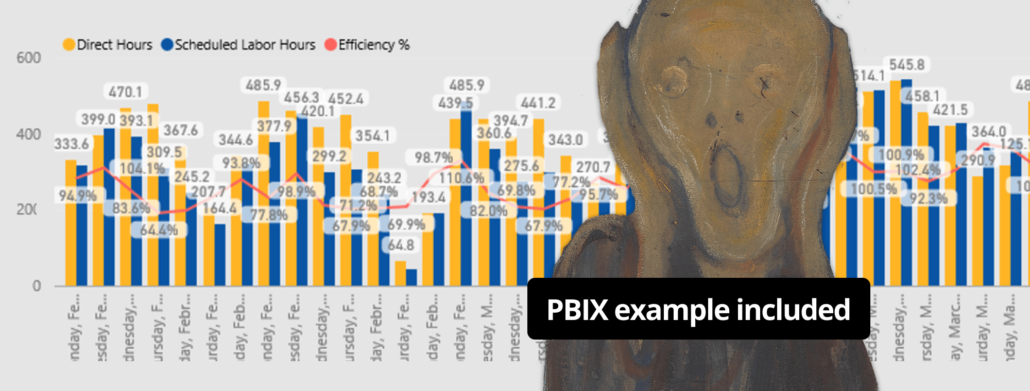
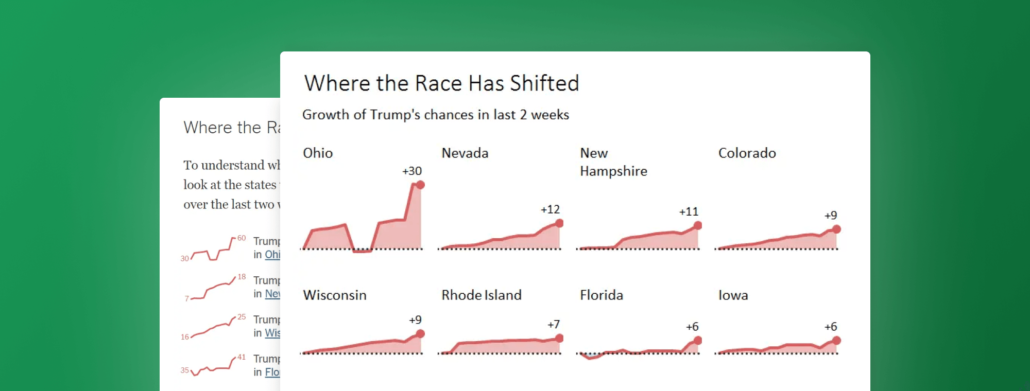
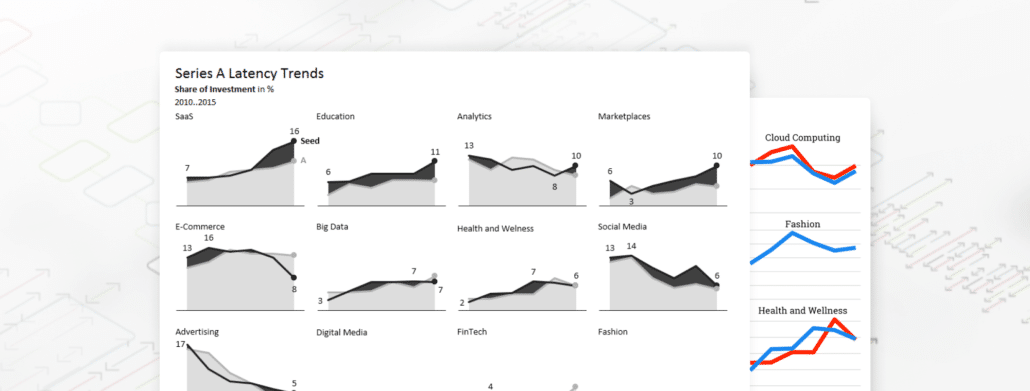
This visualization fails to convey a proper picture of the trends due to inconsistent scaling of charts. Learn 3 alternative solutions how to adress this problem.
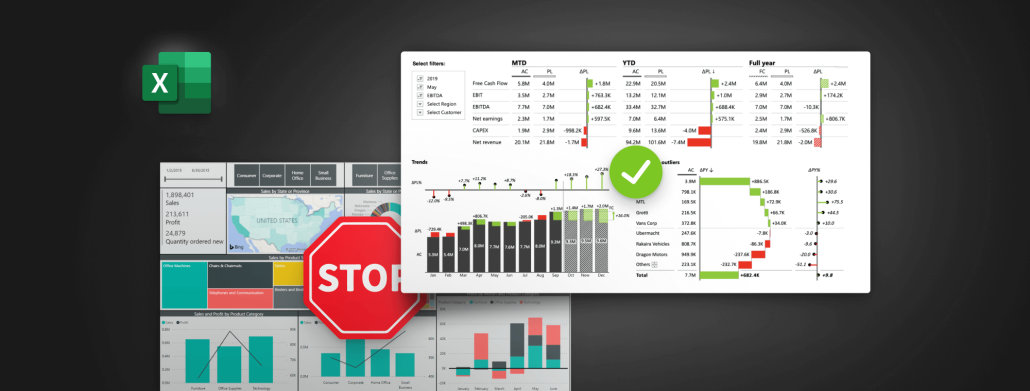
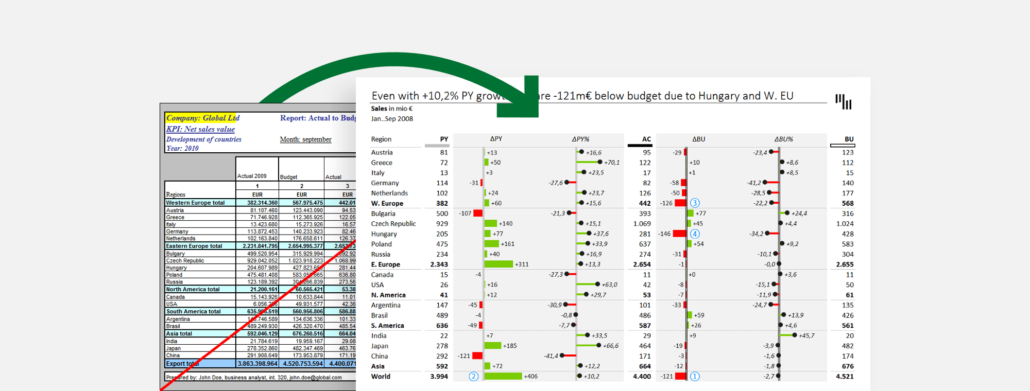
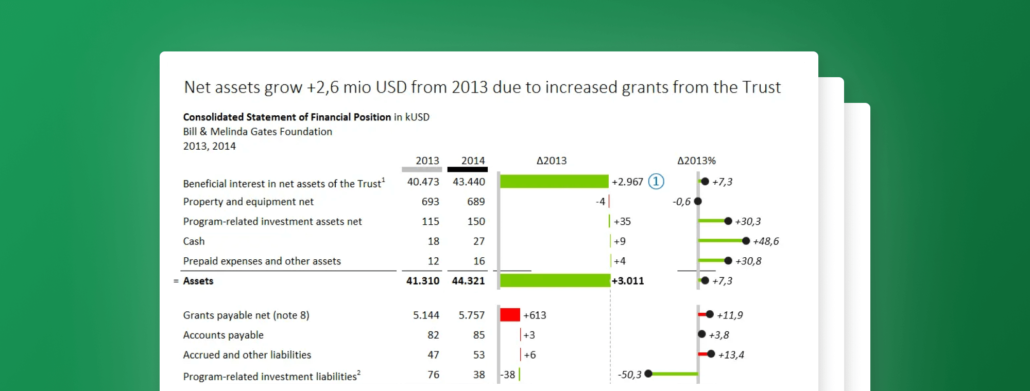
The internet is full of bad examples of variance reports. Follow this guide to see how we turn one such example into a great and efficient variance report.
 September 8th
 February 22nd