Zebra AI is designed for teams that need clarity at decision time. Now it is generally available (GA) in Microsoft Fabric where you can try it on your data.
Our Cost Benefit Analysis Template helps you get all the important bits of information in one place, in an easy-to-understand way, to help you decide whether to proceed with a project or not.
Optimize your Food & Beverage business with our Financial Analysis and Benchmarking Report Dashboard Template. Perfect for executives and financial analysts, it evaluates KPIs such as Inventory Turnover and Return on Assets to drive strategic growth, operational efficiency, and market competitiveness.
Optimize your Food & Beverage business with our Financial Analysis and Benchmarking Report Dashboard Template. Perfect for executives and financial analysts, it evaluates KPIs such as Inventory Turnover and Return on Assets to drive strategic growth, operational efficiency, and market competitiveness.
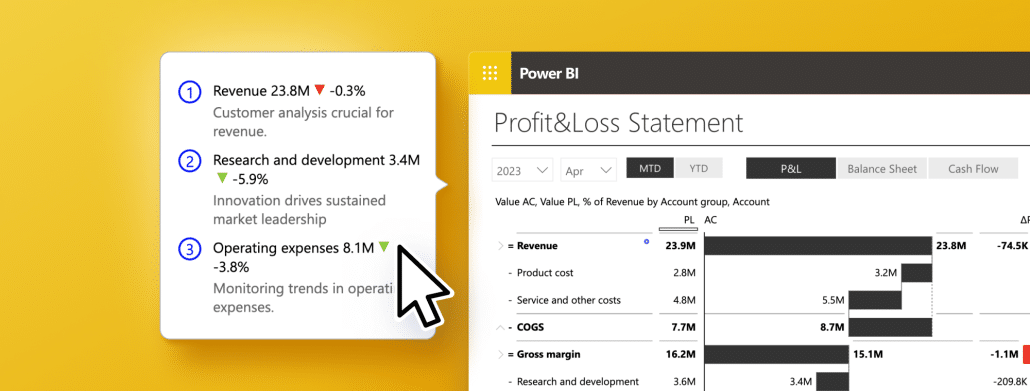
Find out why you should include comments in Power BI reports to deliver clear context and insights, which will help you make informed and strategic decisions.
 September 8th
 February 22nd