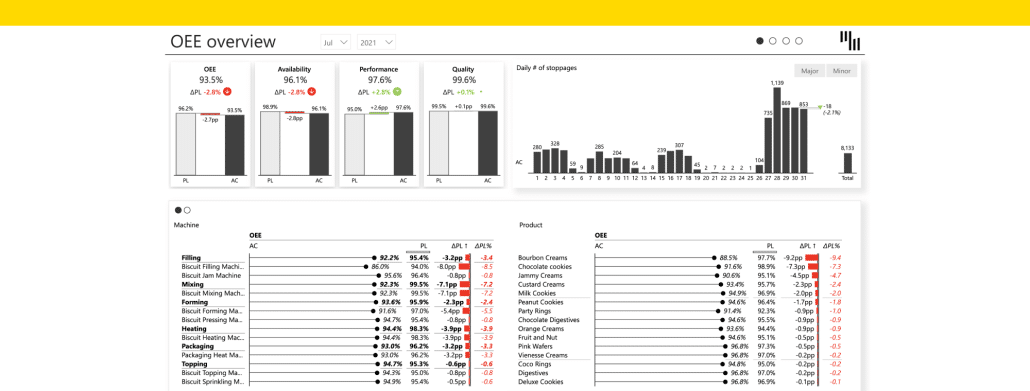
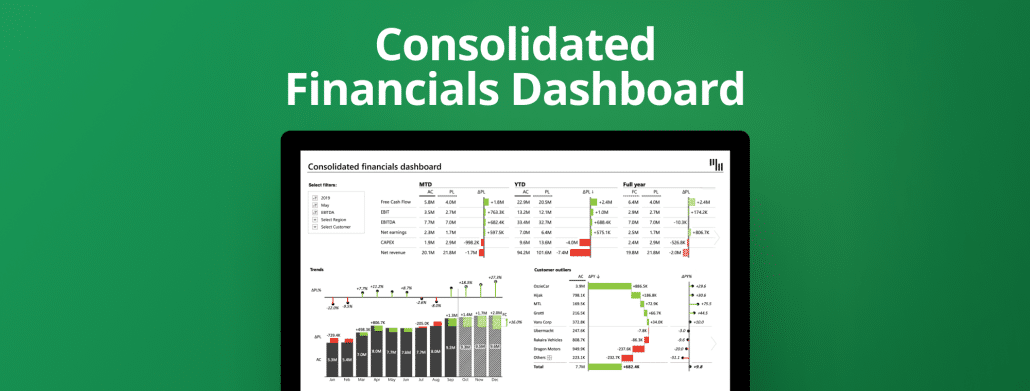
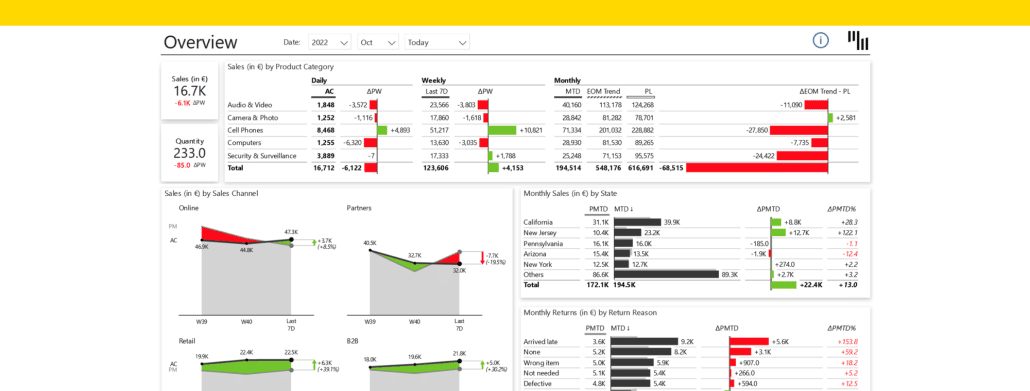
This advanced template brings a complete overview of your financial performance. You can see the complete overview of different KPIs, trends, and customer outliers. For more details use filters and immediately see what you're looking for.
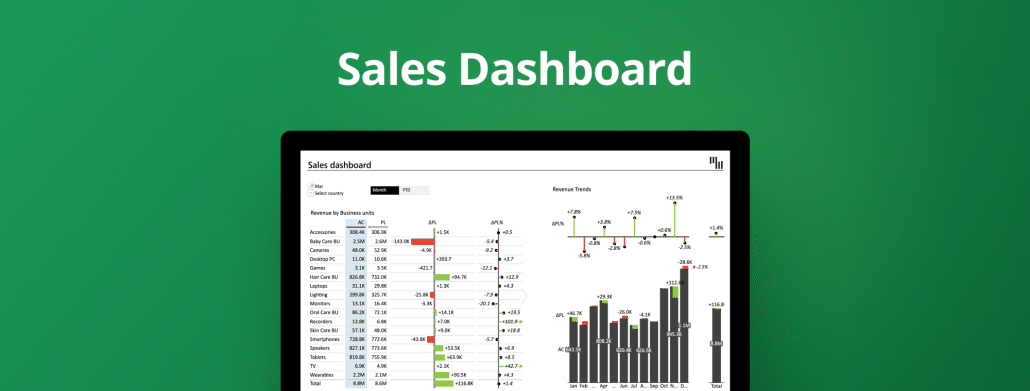
Use this interactive template for a complete overview of your sales performance with comparisons, trends, and slicers for tracking the month-to-date & year-to-date changes.
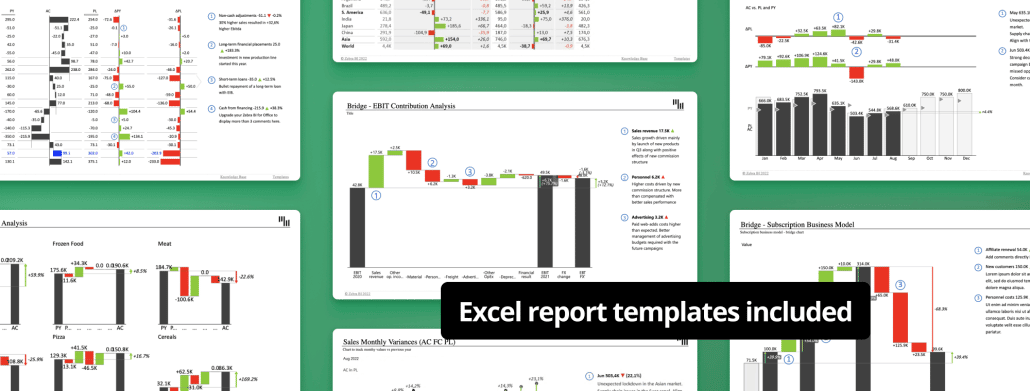
If you take just a couple of minutes, you can rethink your approach to creating and designing your business reports. In this article, you can find key Excel report templates for some of the most commonly used business reports.
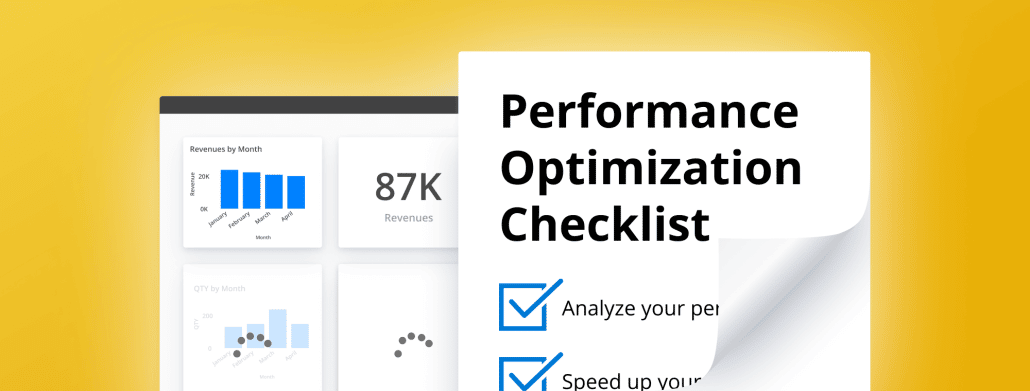
Slow reports are an issue most users struggle with when it comes to Power BI. What can you do about it? Register for this live session to speed up your reports and improve the experience for your end users NOW.
 September 8th
 February 22nd