 September 8th
 February 22nd
Transform Your Reporting with Power BI Financial Dashboards: Insights Made Simple
PRO Trial
Key Takeaways
- Power BI offers advanced visualization and analysis tools, enabling businesses to create clear, interactive, and insightful power bi financial dashboards that surpass traditional tools like Excel and PowerPoint
- Power BI supports various types of financial analysis including trend, variance, financial statement, and cost analysis, helping organizations uncover deeper insights and make informed decisions
- Features like drill-downs, filtering, and automated data refreshes make Power BI dashboards dynamic, user-friendly, and always up-to-date, saving time and improving decision-making
- Power BI seamlessly integrates with multiple data sources and offers highly customizable dashboards, allowing businesses to consolidate data and tailor reports to their specific needs
- Zebra BI enhances Power BI's capabilities by providing automated variance analysis, standardized reporting, and ready-made templates, simplifying complex financial reporting and improving efficiency for financial teams
Your ability to visualize data correctly is crucial.
It helps you:
- Deliver quality reports that stakeholders, other CXOs, and Board members can understand (and draw business insights from)
- Make better decisions for the financial health of your organization
- And ensure there's consistency in how financial data is both presented and used in your company
Microsoft Power BI is an undoubted ally in your effort to draw quality insights from raw data. A Power BI financial dashboard will help you create explanatory/ management reports, as well as exploratory/ self-service reports, which means it's helpful for decision-makers and other business users alike. The advanced interactivity and visualization capabilities make it a superior option to PowerPoint, Excel, or other similar tools, bringing your financial reporting to a whole new level.
That said, Power BI isn’t flawless—so if you’re looking to unlock its full potential and get more value from your reports, keep reading.
Watch this clip to learn how to spot common performance issues in Power BI financial dashboards and why they slow down your reports.
If you’re serious about building Power BI reports that scale and delight your users, this webinar is a must-watch. Watch the full recording now »
Why Use Power BI for Your Financial Dashboards?
Power BI combines powerful features that make it the go-to tool for finance dashboards:
1. Visualization and Analysis Capabilities
Power BI offers a wide array of visual tools, including charts, graphs, tables, and matrices, to help businesses present financial data in a clear and engaging way. These visuals enable you to spot trends, analyze performance, and communicate insights effectively to stakeholders.
Furthermore, Power BI excels not only at visual representation but also at robust financial analysis, allowing businesses to unlock deeper insights into their financial performance. It offers a wide range of analytical tools and capabilities that help organizations understand their data from various angles. Below are some of the key types of financial analysis that Power BI enables:
- Trend analysis: Identify patterns and behaviors over time to predict future trends and make informed decisions.
- Variance Analysis: Compare differences in metrics such as Plan vs Actuals, Forecast vs Actuals, and Previous Year vs Actuals to determine areas of deviation.

- Financial Statement Analysis: Gain insight into financial health by analyzing income statements, balance sheets, and cash flow statements.

- Structural (Breakdown) Analysis: Break down financial data into granular components to understand how each contributes to the overall picture.

- Financial Ratio Analysis: Use key ratios to evaluate financial performance, such as net profit and loss (P&L) Analysis, liquidity, and efficiency metrics.

- Contribution Analysis: Assess how individual elements or business segments contribute to total performance or results.

- Cost Analysis: Explore and optimize cost structures to improve efficiency and profitability.

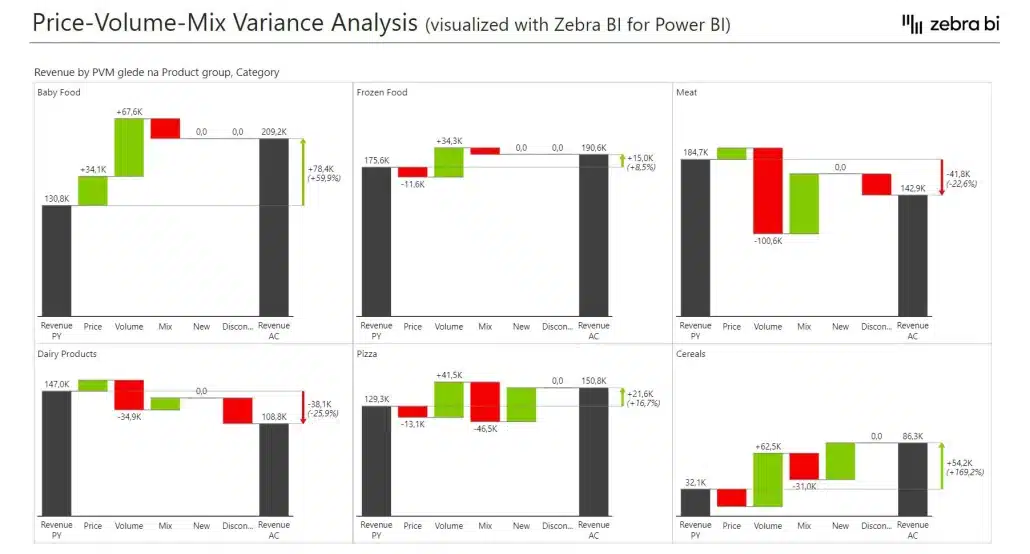
- Price-Volume-Mix Analysis: Examine the relationships and impacts of price changes, volume shifts, and mix variations on profitability.

- Drill-Down Financial Exploration: Navigate from higher-level overviews to transaction-level details for thorough investigation.

- Scenario Analysis: Simulate financial outcomes under various conditions to better prepare for uncertainties and strategic planning.
2. Interactivity
Power BI empowers users with interactive tools to explore their data. With features like drill-downs, filtering, and slicing, users can dive deeper into different dimensions of financial performance, uncovering detailed insights that static reports simply can't provide.
3. Automation
Automation in Power BI saves valuable time by streamlining repetitive tasks. Businesses can set up automatic data refresh schedules, eliminating the need for manual updates. This ensures that dashboards always display up-to-date financial information for decision-making.
4. Data Governance
With Power BI, businesses can maintain robust data governance protocols and ensure a single source of truth for all users and decision-makers. It offers tools to enforce security, manage user access, and ensure data integrity, providing an added layer of trust and reliability in financial reporting.
5. Integration with Multiple Data Sources
It's 2025, no one should have to manually copy-paste data from one tool to the next. Not only is it not what you got a degree for, it's also inefficient and increases the potential for human error.
Power BI seamlessly integrates with a wide range of data sources, including Excel, SQL databases, cloud services, and third-party apps. This flexibility allows businesses to consolidate and analyze all their financial data from various platforms in one place.
6. Customization
Power BI dashboards are highly customizable to meet specific business needs. Users can tailor views, create personalized reports, and design dashboards that focus on key financial metrics, providing insights that best align with organizational goals.
7. Accessibility
Power BI dashboards are designed to work across multiple devices, including desktops, tablets, and mobile phones. This ensures that users can access critical financial insights anytime, anywhere, whether they’re in the office or on the go.
8. Collaboration
Power BI facilitates seamless collaboration by enabling teams to share and work on dashboards together. This collaborative approach makes financial analysis more streamlined, ensuring that all stakeholders stay aligned and up to date with the latest insights.
Common Financial Metrics and Reports
Power BI simplifies the tracking of essential financial metrics and generates reports that provide valuable insights. Some of the most commonly used reports include:
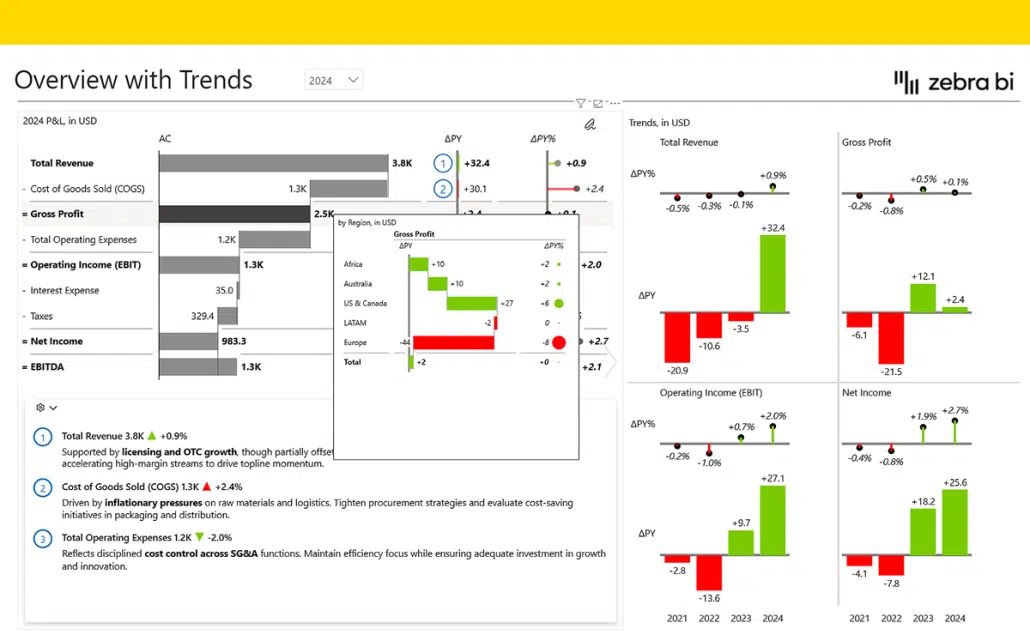
- Income Statement
The income statement is a key financial document that tracks a company’s financial performance over a specific period. It includes total revenue earned, the cost of goods sold (COGS), gross profit, operating expenses, and overall profits or losses. This report helps businesses understand their profitability and identify areas where they can improve efficiency or cut costs.
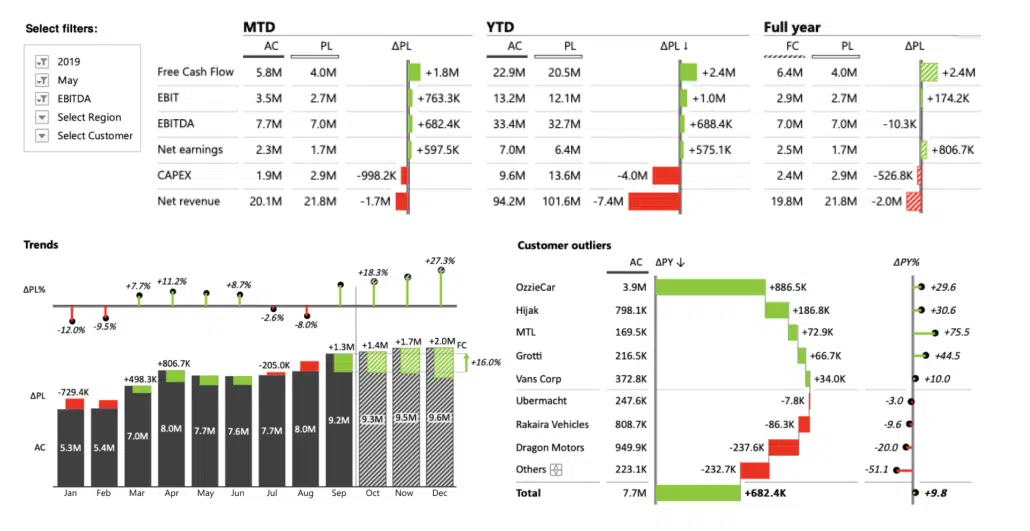
- Cash Flow Statements
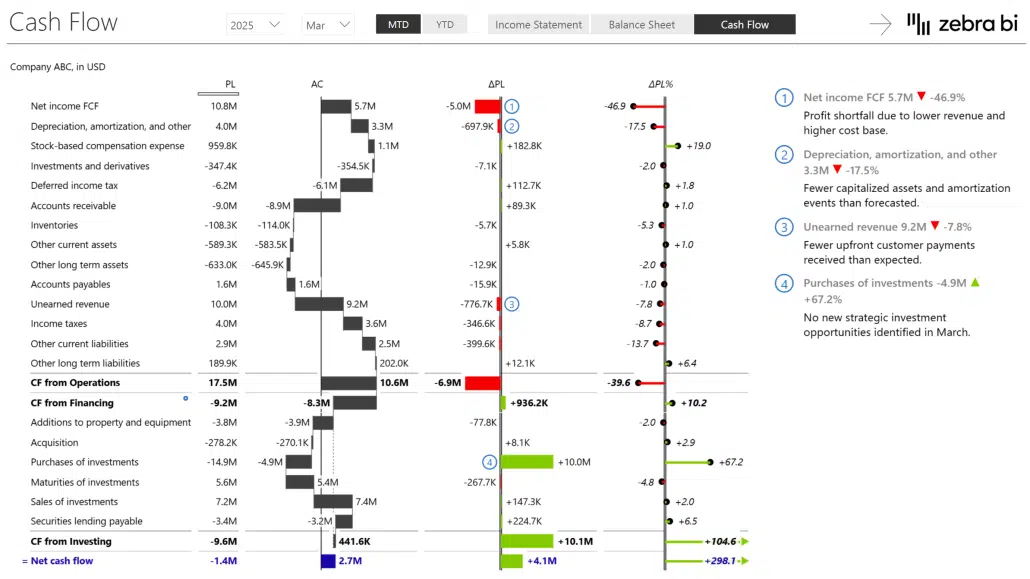
Cash flow statements provide a clear visualization of the movement of cash in and out of a business. They highlight cash generated from operations, investments, and financing activities, giving insight into the business’s liquidity and its ability to meet financial obligations.
- Balance Sheet
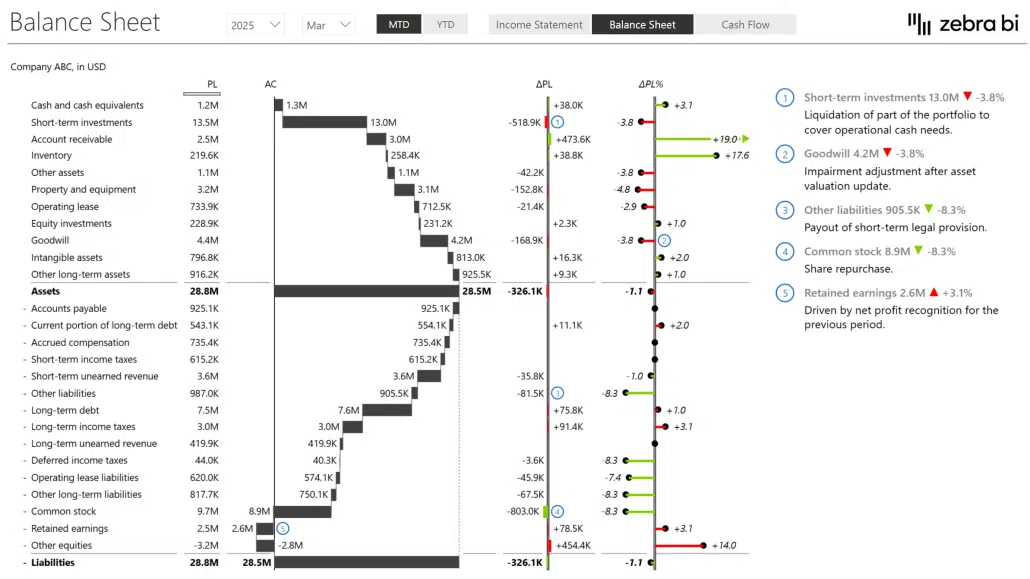
The balance sheet is a financial snapshot of a company at a specific point in time. It includes details about assets, liabilities, and equity, helping stakeholders evaluate the financial health and stability of the business. It’s an essential tool for both internal analysis and external reporting.
- Profit Margins

Profit margin analysis measures the profitability of a company by examining ratios such as gross profit margin and net profit margin. These metrics help businesses determine how much income they retain after covering production costs and operating expenses.
- Sales Performance

Analyzing sales performance allows businesses to identify trends, top-performing products, and geographic sales patterns. This data is crucial for refining marketing strategies, improving sales techniques, and boosting total revenue.
By the way, you want to learn more about building insightful sales dashboards in Power BI, check out our guide about this!
- Operational Expenses (OpEx)

Operational expenses (OpEx) represent the ongoing costs of running a business. Monitoring and optimizing these costs ensures the company operates efficiently while minimizing unnecessary spending, which can directly impact profitability.
How to Create an Actionable Power BI Dashboard
Creating a finance dashboard in Power BI involves several steps. Each step is essential to ensure the dashboard is both actionable and user-friendly:
1. Define Your Goals
Clearly outline what you want to achieve with your dashboard. Whether it’s tracking KPIs, identifying trends, or simplifying reporting, your goals will shape the dashboard design. A well-defined goal ensures your dashboard provides actionable insights and avoids unnecessary clutter.
2. Gather and Clean Your Data
Collect all necessary financial data and clean it to ensure accuracy. Where possible, handle data preparation upstream in the BI process to save time, perform report performance optimization, and maintain consistency. Clean, well-structured data is the foundation for reliable analysis and impactful visualizations.
3. Connect Power BI & Your Data Sources
Link your Power BI workspace to data sources, such as ERP systems, databases, or Excel files, to ensure seamless integration. Establishing these connections ensures real-time updates and reduces manual data handling.
4. Create Data Models
Build robust data models that structure the information in a meaningful way, enabling smoother analysis and visualization. Thoughtfully designed financial data models improve efficiency and make it easier to uncover insights.
5. Create Visualizations
Use Power BI’s wide range of visualization tools to design charts, graphs, and tables that effectively communicate the data. Tailor your visualizations to highlight key metrics and trends for clearer storytelling.
6. Incorporate Interactivity, Formatting, and Themes
Enhance the user experience by adding interactivity, such as drill-throughs, tooltops, bookmarks, and slicers, and applying consistent formatting and themes. These features make your dashboard intuitive and engaging for end-users.
7. Publish & Share
Share your dashboard securely with relevant stakeholders to enable collaboration and informed decision-making. Use Power BI’s sharing options to maintain control over access and ensure data privacy.
Want to see this in action? In one of our recent webinars, our Lead Power BI Consultants showcased how anyone can simplify data analysis and visualization with Power BI and Zebra BI.
Challenges and Limitations in Creating Financial Power BI Dashboards
While Power BI is a powerful tool, it comes with some challenges:
- Time-Consuming
Creating a dashboard from scratch can be a daunting task, especially for beginners. It requires not only technical knowledge but also an understanding of how to structure and present data effectively.
For those unfamiliar with data visualization tools, the process can take hours or even days, delaying decision-making and reducing overall efficiency.
- Variance Explanations
Explaining variances in financial data is often challenging and time-intensive. Without the right tools or templates, identifying and illustrating the reasons behind changes in metrics can feel overwhelming.
This can lead to miscommunication or missed opportunities to address key issues. Advanced features, such as automated variance analysis, can simplify this process but are not always accessible.
- Insight Limitation
Dashboards that are visually appealing don’t always translate into actionable insights. When dashboards focus solely on aesthetics rather than functionality, the result can be a lack of meaningful data to guide decisions. Poorly designed dashboards may leave users with more questions than answers, reducing the overall value of the tool.
- Performance Issues
Larger datasets are often the backbone of meaningful analysis, but they can also lead to performance problems. Dashboards can become slow and unresponsive when handling massive amounts of data, frustrating users and slowing down workflows. Optimizing dashboard performance requires technical expertise and may involve trade-offs between speed and depth of analysis.
- Maintenance
Keeping dashboards updated and functional over time can be a significant challenge, especially for smaller teams with limited resources. Regular maintenance is often required to ensure data accuracy, update integrations, and add new features. Without dedicated IT support, these tasks can become a burden, leading to outdated dashboards that fail to meet the needs of the business.
The good news to all this?
You don't have to go through all that. You can reduce the time it takes to create financial dashboards, maintain them easier, be able to explain variances in a smooth way, and make your finance dashboards super interactive (and ready to provide you with the business insight you need for that).
The answer lies in two words: Zebra BI.
For a deeper dive into all the techniques and real-world examples, watch the full webinar Best Practices for Power BI Report Optimization.
Why Leading Financial Teams Use Zebra BI
To address some of Power BI’s limitations, many financial teams turn to tools like Zebra BI, which enhances Power BI’s functionality for financial reporting. Zebra BI is designed specifically for financial experts and offers several advantages:
- Automated Variance Analysis
Easily identify and understand discrepancies in your performance metrics with automated variance analysis. This feature saves time by pinpointing areas that need attention and providing clear explanations for variances, allowing you to focus on strategic decision-making rather than manual data investigation.
- Drill Down Capabilities
Dive deeper into your data with robust drill-down capabilities. Whether you’re analyzing cost centers, business units, or GL accounts, this feature allows you to uncover insights at a granular level. Gain a detailed understanding of your business performance without wading through overwhelming financial information.
- Standardized Reporting
Ensure consistency and compliance with standardized reporting that adheres to International Business Communication Standards (IBCS). Create reliable, professional-grade reports that meet industry benchmarks and provide stakeholders with the clarity they need for confident decision-making.
Here's a quick case study on how Raiffeisen uses our tool to standarize their reports.
- Complex Reporting Made Easy
Simplify multi-version reporting and develop advanced comparative statements with ease. This feature streamlines the creation of complex reports, allowing you to analyze different scenarios and provide actionable, real-time insights to drive better business outcomes.
Want to see how others use Zebra BI to simplify otherwise complex reports?
Here's what W.L Gore did, for example.
Who Uses Zebra BI?
Financial leaders across industries rely on Zebra BI, including:
1. CFOs (Chief Financial Officers)
For CFOs, staying on top of financial performance across the board is critical. Whether it’s tracking profits or presenting data to executives, having the right tools (like Zebra BI) makes all the difference. Here’s how you can streamline your workflow:
- Track P&L performance indicators across regions, subsidiaries, or product lines.
- Monitor EBITDA, gross margin, and cash flow trends at a glance.
- Create executive-ready dashboards with consistent layout and visual storytelling.
- Present year-over-year and multi-year trends using CAGR arrows and waterfall charts.
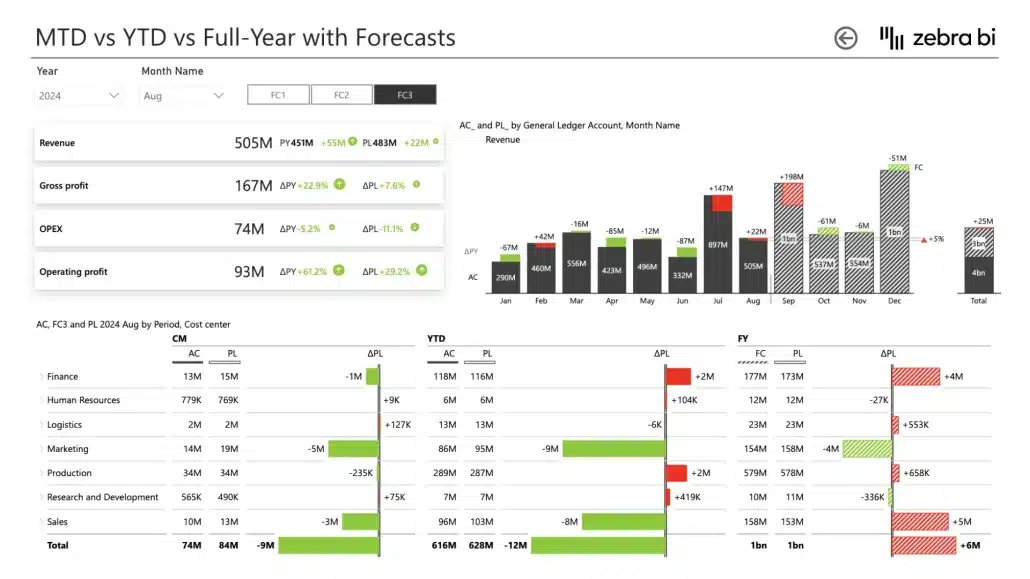
- Visualize budget vs. actual vs. forecast with built-in variance charts.
- Standardize financial communication across the company.
2. FP&A (Financial Planning & Analysis) Teams
Financial Planning & Analysis teams play a crucial role in forecasting and analyzing data to drive strategic decisions. With tools like Zebra BI, designed to simplify complex processes, FP&A teams can:
- Build scenario comparisons and conduct what-if analysis.
- Track forecast vs. actual performance with flexible comparisons.
- Break down revenue growth drivers (e.g., price-volume-mix) using waterfall charts.
- Automate monthly and quarterly forecasts with refreshable Zebra visuals.
- Create driver-based planning dashboards and shareable templates.
- Enable faster and clearer presentation of complex metrics to stakeholders.
3. Controllers
Controllers are responsible for ensuring financial accuracy and consistency in reporting. By utilizing Zebra BI, controllers can:
- Produce standardized month-end and close reports.
- Highlight cost center performance and budget adherence using IBCS-compliant visuals.
- Ensure visual consistency across all reporting packages.
- Spot and explain accounting variances using dynamic comments and breakdowns.
- Automate repetitive reporting workflows with refreshable Power BI reports.
- Visualize hierarchical financial structures (e.g., by division, cost type, location).
4. Business Unit Leads / Operational Managers
Business Unit Leads and Operational Managers oversee key metrics that drive day-to-day performance. With the right insights, they can align with finance and make data-driven decisions effectively. They can:
- Track cost performance and operational KPIs in real time.
- Monitor sales, gross margin, and productivity metrics with visual alerts.
- Drill down into product, customer, or regional performance.
- Align with finance using shared reporting templates and visual standards.
- Use dynamic comments to communicate local performance context.
- Review performance vs. targets quickly and effectively.
Want to know how Zebra BI is used out there?
Read more about it in our case studies:
- Heijmans case study, where they turned their financial data into a real powerhouse of insights
- Abbott's case study, which turned their outdated Excel reports into interactive, actionable Power BI reports
- W. L. Gore's case study, which saved hundreds of hours in reporting and data analysis
Zebra BI Power BI Financial Dashboard Examples for Power BI
Zebra BI provides ready-made templates for Power BI, making it easier to create complex Power BI financial dashboards. Some examples include:
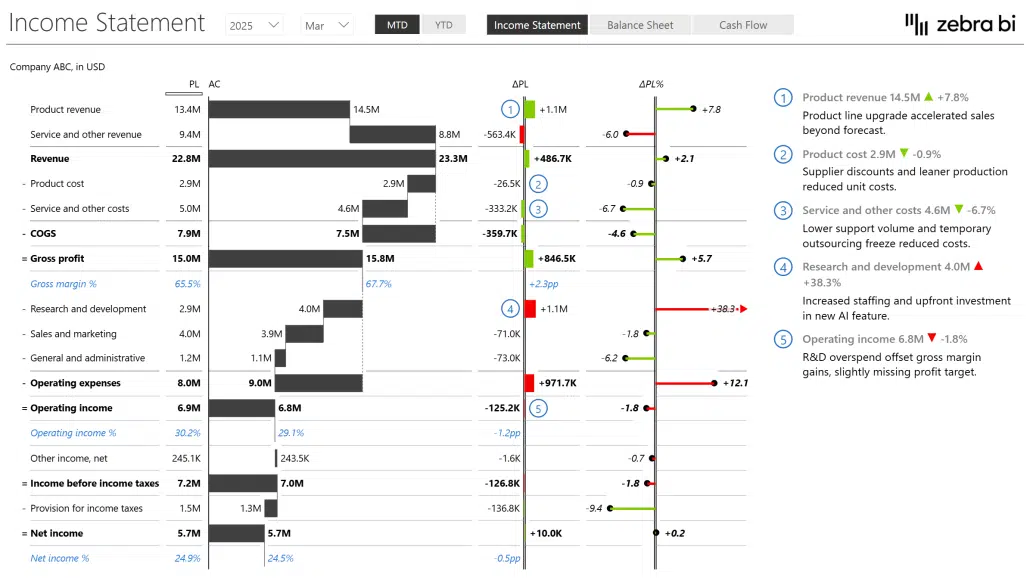
1. Income Statement Power BI Template
Gain a clear and detailed overview of your company's financial performance with the Zebra BI Income Statement Template. It allows you to effortlessly track revenues, expenses, and profits, all presented in a visually intuitive format. With interactive visuals and automatic updates, you can make data-driven decisions faster and with confidence.

2. Consolidated Financials Power BI Template
Simplify your financial reporting across multiple entities with the Zebra BI Consolidated Financials Template. This Power BI dashboard template aggregates data seamlessly, providing a unified view of your organization’s financial health. This template saves time and reduces errors, ensuring you get accurate insights for strategic decision-making.
3. Annual Comparative Statement Power BI Template
Quickly compare year-over-year financial data with Zebra BI’s Annual Comparative Statement Template. Identify trends, spot anomalies, and analyze growth patterns with precision. This template’s interactive charts and tables make it easy to communicate performance to stakeholders.
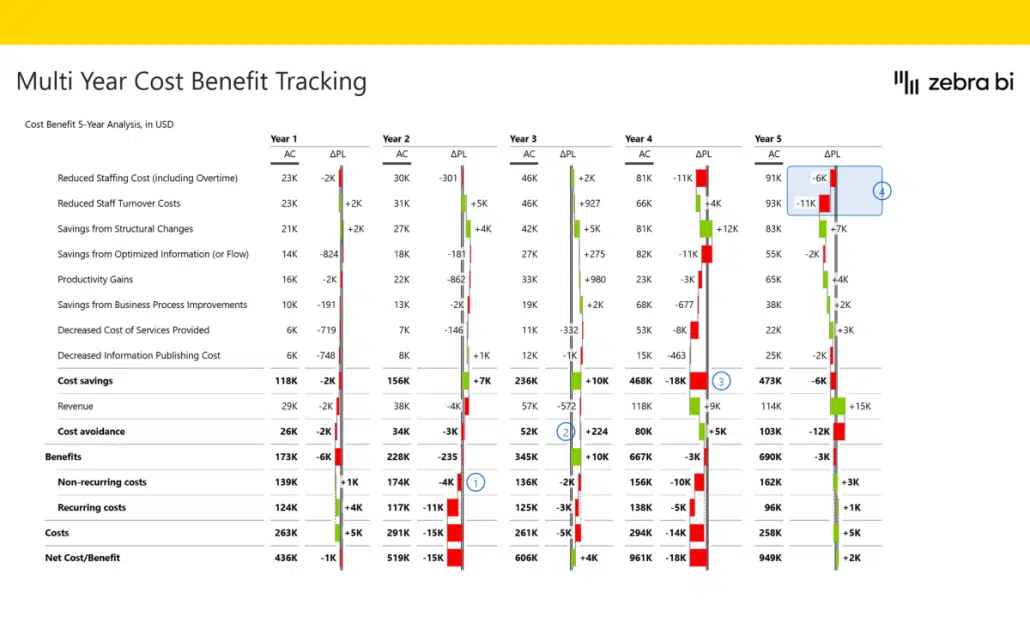
4. Cost-Benefit Analysis Power BI Template
Make smarter investment decisions with the Zebra BI Cost-Benefit Analysis Template. It highlights the potential costs and benefits of decisions in an easy-to-understand format, helping you evaluate ROI and risk with clarity. Save time and focus on impactful outcomes with automated data connectivity and calculations.
5. Cost Management Power BI Template
Gain full control over your expenses with the Zebra BI Cost Management Template. It allows you to monitor, analyze, and optimize costs in real-time. With advanced visual comparisons and trend analysis, this template helps you identify inefficiencies and reduce unnecessary spending.
6. Price Volume Mix Analysis Power BI Template
Get deeper insights into the drivers of your revenue changes with the Zebra BI Price Volume Mix Analysis Template. By breaking down revenue into price, volume, and mix effects, this template helps you pinpoint areas for improvement and refine your pricing and sales strategies for maximum profitability..How to Use Zebra BI Dashboard Templates for Power BI
Zebra BI templates are created by financial experts to simplify the dashboard creation process. These templates save time and ensure compliance with best practices, empowering users to focus on analyzing data rather than building dashboards from scratch.
By combining Power BI’s flexibility with Zebra BI’s advanced financial reporting capabilities, teams can create dashboards that are not only visually impressive but also actionable and insightful.
How to Use Zebra BI Dashboard Templates for Power BI
Zebra BI templates are created by financial experts to simplify the dashboard creation process. These templates save time and ensure compliance with best practices, empowering users to focus on analyzing data rather than building dashboards from scratch.
By combining Power BI’s flexibility with Zebra BI’s advanced financial reporting capabilities, teams can create dashboards that are not only visually impressive but also actionable and insightful.
The easiest way to get rapid access to the best Zebra BI features for your Power BI financial dashboards is by grabbing a template from the list mentioned above:
1. Download this power bi template/example to find best practices and inspiration for actionable reporting techniques.
2. Use sample data to test it out and check what is the background to find application to your use cases.
3. Use free trial or and other Zebra BI plan to create financial dashboards with Zebra BI visuals on your own data.
FAQs
What is a financial dashboard in Power BI?
A Power BI financial dashboard is an interactive report that visualizes key financial metrics such as revenue, expenses, profit, and variances. It allows finance teams to track performance, compare actuals vs. budget, and deliver insights in real time.
How to make a financial dashboard in Power BI?
To create a financial dashboard in Power BI, start by defining your goals and identifying the key metrics you want to track. Gather and clean your financial data, connect Power BI to your data sources, and build data models to structure the information. Use Power BI’s visualization tools to create charts, graphs, and tables, and enhance the dashboard with interactivity like slicers and drill-throughs. Finally, publish and share the dashboard with stakeholders for collaboration and decision-making.
Is Power BI good for financial reporting?
Yes, Power BI is an excellent tool for financial reporting. It offers advanced visualization capabilities, robust analytical tools, and seamless integration with various data sources. Power BI enables businesses to create interactive, real-time dashboards that provide actionable insights, making it a superior choice for financial reporting compared to traditional tools like Excel or PowerPoint.
Can you build a financial model in Power BI?
Yes, you can build a financial model in Power BI. By leveraging its data modeling capabilities, you can structure financial data, perform calculations, and create dynamic visualizations. Power BI also supports scenario analysis, variance analysis, and forecasting, making it a powerful tool for building and analyzing financial models.
Can you use Power BI as a dashboard?
Absolutely, Power BI is designed to create and use dashboards. It allows users to consolidate data from multiple sources, visualize key metrics, and interact with the data in real time. Power BI dashboards are highly customizable and accessible across devices, making them a versatile tool for monitoring and analyzing business performance.
Why should finance teams use dashboards in Power BI instead of Excel reports?
Dashboards in Power BI are dynamic, interactive, and scalable. Unlike static Excel reports, they update automatically, allow drill-down into details, and can be standardized across teams — saving hours of manual work and reducing errors.
What are the 3 key financial statements often included in Power BI dashboards?
The three most common financial statements are:
Income Statement (P&L): Profitability over a period.
Balance Sheet: Assets, liabilities, and equity at a point in time.
Cash Flow Statement: Cash inflows and outflows, highlighting liquidity.
Can I create financial dashboards in Power BI without coding?
Yes. Native Power BI visuals offer some capabilities, but tools like Zebra BI automate advanced requirements such as variance analysis, subtotals, and IBCS-compliant layouts — so finance teams don’t need to write complex DAX formulas.
What are common challenges when building financial dashboards in Power BI?
Manual variance calculations (time-consuming, error-prone).
- Inconsistent report layouts across teams.
- Difficulty combining actuals, budgets, and forecasts.
- Slow dashboards with large datasets.
- Zebra BI helps solve these with built-in variance logic, standard templates, and optimized - visuals.
What are the best practices for designing a financial dashboard in Power BI?
- Keep layouts simple and consistent (IBCS standards).
- Use variance analysis to explain why results changed.
- Provide drill-down paths for context.
- Include both high-level KPIs and detailed breakdowns.
- Standardize colors and scales across all visuals.
Do you have examples of financial dashboards in Power BI?
Yes. You can explore free Zebra BI financial dashboard templates such as Income Statement, Annual Comparative Statement, and Consolidated Financials.
Can financial dashboards be consolidated across subsidiaries or business units?
Absolutely. Power BI combined with Zebra BI supports consolidated reporting across multiple entities, ensuring one standardized reporting language and allowing group-level comparisons.
How do Power BI dashboards support audited or regulatory reporting?
While dashboards don’t replace audited financial statements, they can be designed to follow international standards (like IFRS or IBCS) and provide management-ready, drillable views that complement official reports.
How do I start using Zebra BI for financial dashboards in Power BI?
Simply start a free trial of Zebra BI for Power BI. You’ll be able to plug visuals into your existing models and instantly create variance-driven, IBCS-compliant financial dashboards without manual setup.